SW Climate Outlook - Monsoon Tracker - Aug 2017
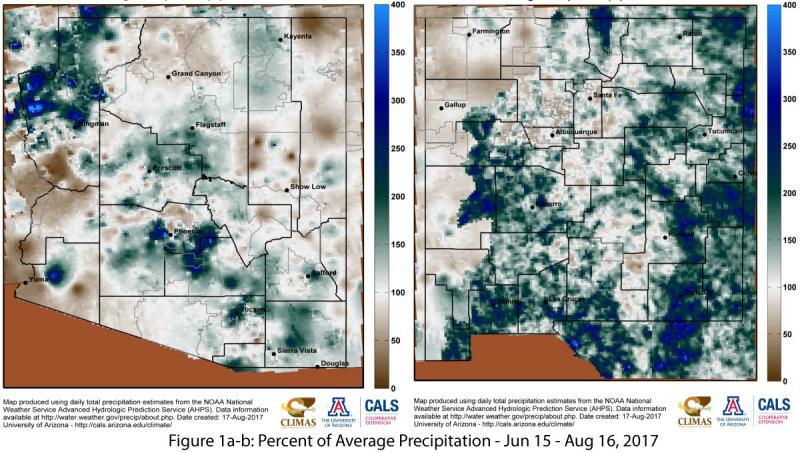
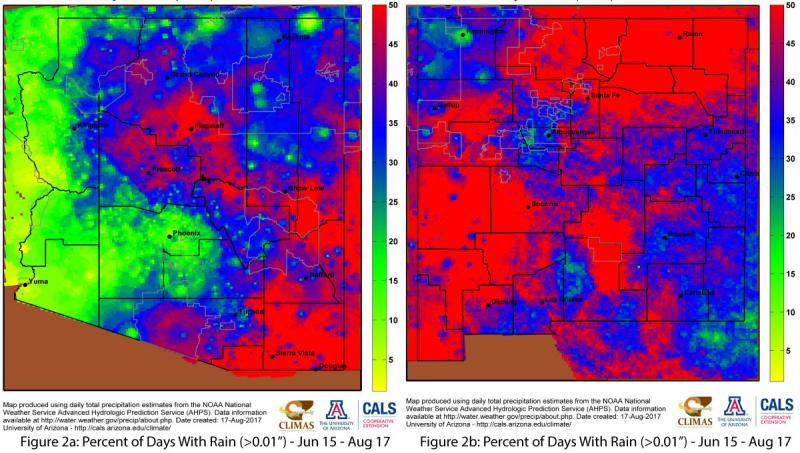
After a relatively late start to the monsoon across much of the Southwest, early-mid July through early August saw an impressive run of storms. Above-average cumulative (through Aug. 14) precipitation is widespread across much of Arizona (Fig. 1a) and New Mexico (Fig. 1b). Exceptions—regions with average and below-average precipitation—occur mostly in Arizona and include the southwest portion of the state, the highlands of the Mogollon Rim, and the north rim of the Grand Canyon, as well as the Four Corners region. These figures highlight the spatial variability of monsoon precipitation and the difficulty of scoring or grading the monsoon performance using single stations or summary maps (but we’re still trying!). Another useful metric that characterizes a different aspect of the monsoon is the percent of days with rain, which, when used with the precipitation maps, distinguishes areas that have received more frequent and moderate precipitation from those in which just a few extreme events boosted seasonal totals. In Arizona, the eastern two-thirds of the state has seen consistent precipitation, ranging from 35 percent to as high as 50 percent of days (Fig. 2a). In contrast, Phoenix and the western edge of the state have had far fewer days with rain. Precipitation frequency is even more uniform across New Mexico, with nearly the entire state recording precipitation on 30 to 50 percent of days (Fig. 2b).
Online Resources / Images Sources
- Figures 1-2 - Climate Science Applications Program
- CLIMAS Monsoon Hub


