SW Climate Outlook - Monsoon Case Study - Tucson July 2017
The onset of monsoon activity seemed to arrive late in Tucson this year, although residents have been rewarded for their patience by a surge of almost daily storms in the region since July 10. Coincidentally, July 10 was also the third straight day of average daily dewpoint temperatures at or above 54 degrees, thereby meeting the monsoon threshold used by NWS Tucson prior to 2008. The average start date by the former definition is around July 3, although in 2015 and 2016 Tucson met this threshold on June 25. By the dewpoint criteria—and given the absence of any measurable precipitation in Tucson in June and early July, the monsoon did start late, but as was discussed in the most recent episode of the CLIMAS Southwest Climate Podcast, the relatively short length of the monsoon and the desire for relief from the extreme heat of June means any delay to the onset feels like an eternity, even if the first big storm day is only a few days or a week after we might normally expect it.
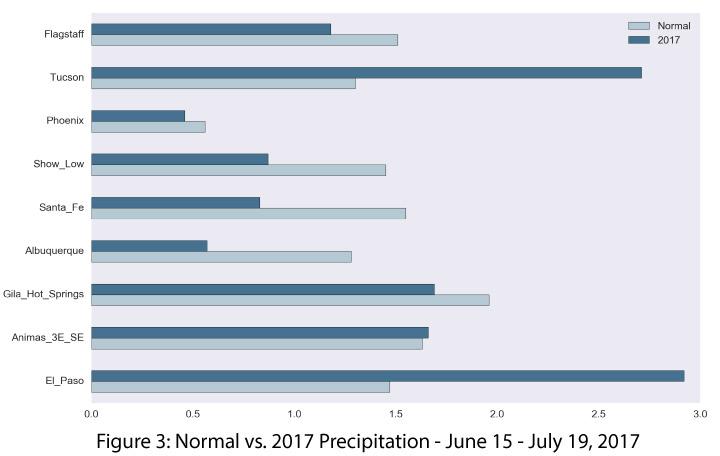
The recent surge of precipitation in southern Arizona has dramatically boosted seasonal totals: the recording station at the Tucson International Airport jumped from zero percent of normal on July 9 to nearly 200 percent of normal by July 19 (Fig. 3). This example illustrates two important points about monsoon-related data:
1) The temporal variability of the monsoon means that daily or weekly tracking can be deceptive, and over the 108 days of the official season, there will be bursts and breaks of activity, with greater chances occurring during the height of the season from early- to mid-July through mid- to late August;
2) Single stations do not capture the spatial variability of the monsoon – a quick visit to rainlog.org on any given storm day will demonstrate the high degree of variability across relatively short distances.

