Monsoon Recap - October 2019
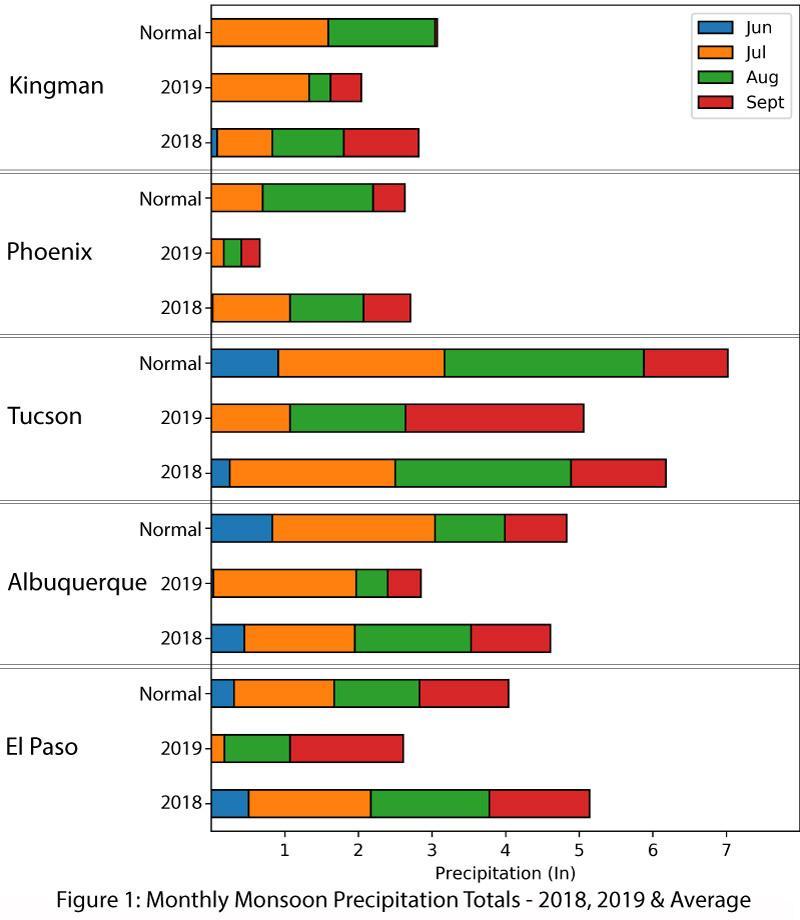
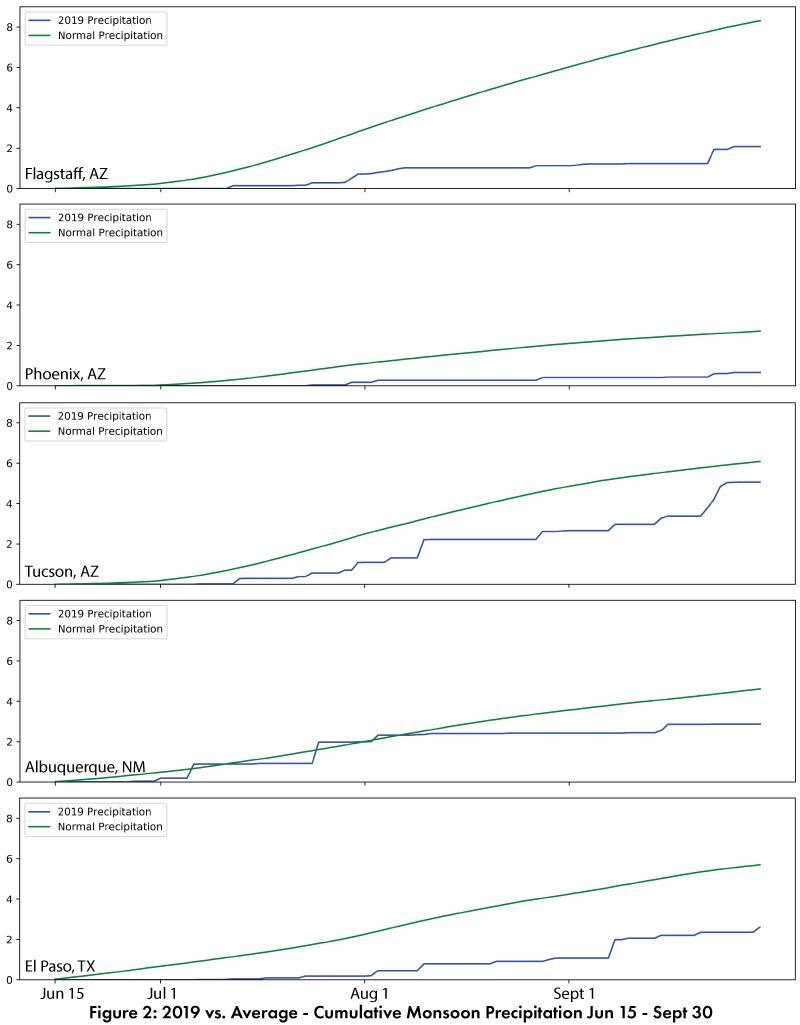
Single weather stations around the region are useful for comparing long term averages to the current year. Figure 1 summarizes monthly precipitation, and shows 2019 lagged behind 2018 and long term averages in most months at most locations. Plots of daily precipitation for stations around the region (Fig. 2) illustrate the slow start and lower than average totals across the region. This monsoon was notable in how much it deviated from the past few years, where many locations in the Southwest saw a run of above normal monsoon precipitation. This made 2019 particularly disappointing. A look at the long term averages demonstrates that 2019 is consistent with some of the drier monsoons on record, even while specific station locations were at or near record driest.
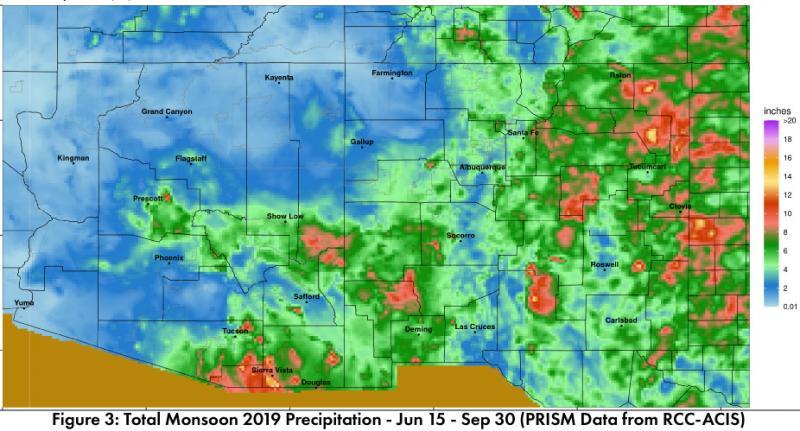
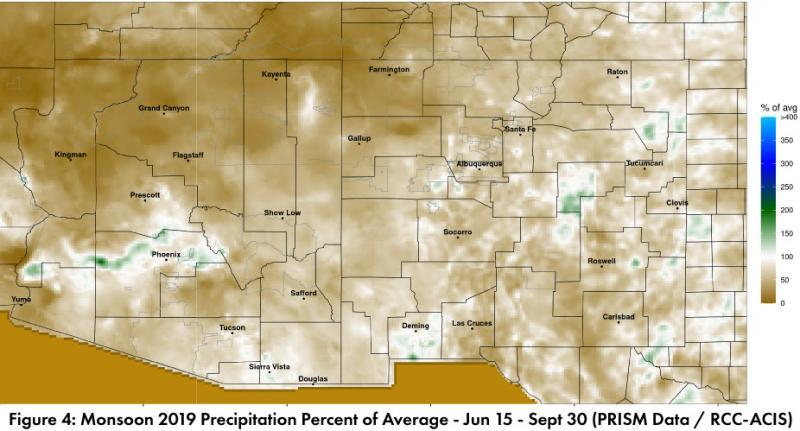
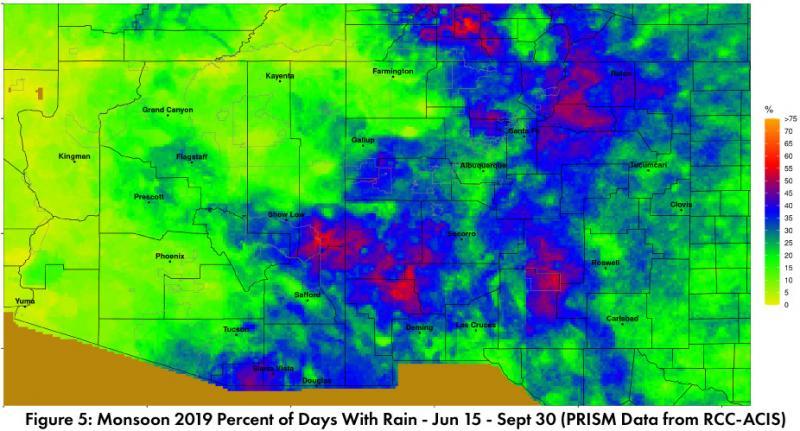
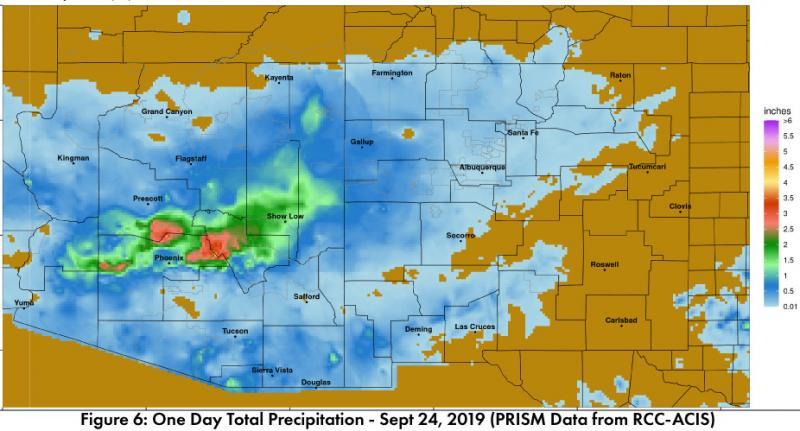
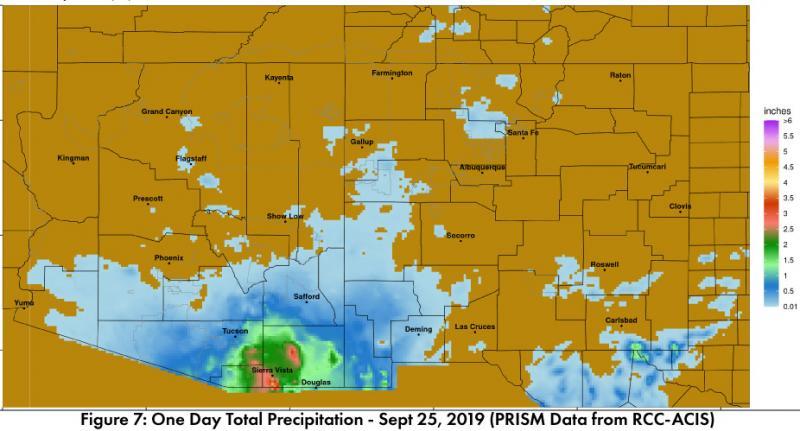
Total monsoon precipitation (Fig. 3) varied across the Southwest, with much of the region recording below normal precipitation (Fig. 4), especially in northern Arizona and the four corners. Percent of days with rain (Fig. 5) highlights the regularity of rainfall events, or lack thereof. This was one of the drier monsoons of recent memory, but is consistent with the range of totals in the long term averages. Tropical storms interacting with a cutoff low triggered intense storms in September (Figs. 6-7 on p. 6), and storm locations and tracks are visible on Fig. 4 between Yuma and Phoenix, having boosted otherwise dry conditions.
Online Resources
- Figures 1-2 - Climate Assessment for the Southwest - climas.arizona.edu
- Figures 3-7 - Climate Science Applications Program - cals.arizona.edu/climate/misc/SWMonsoonMaps/current/swus_monsoon.html

