Monsoon Recap - August 2019
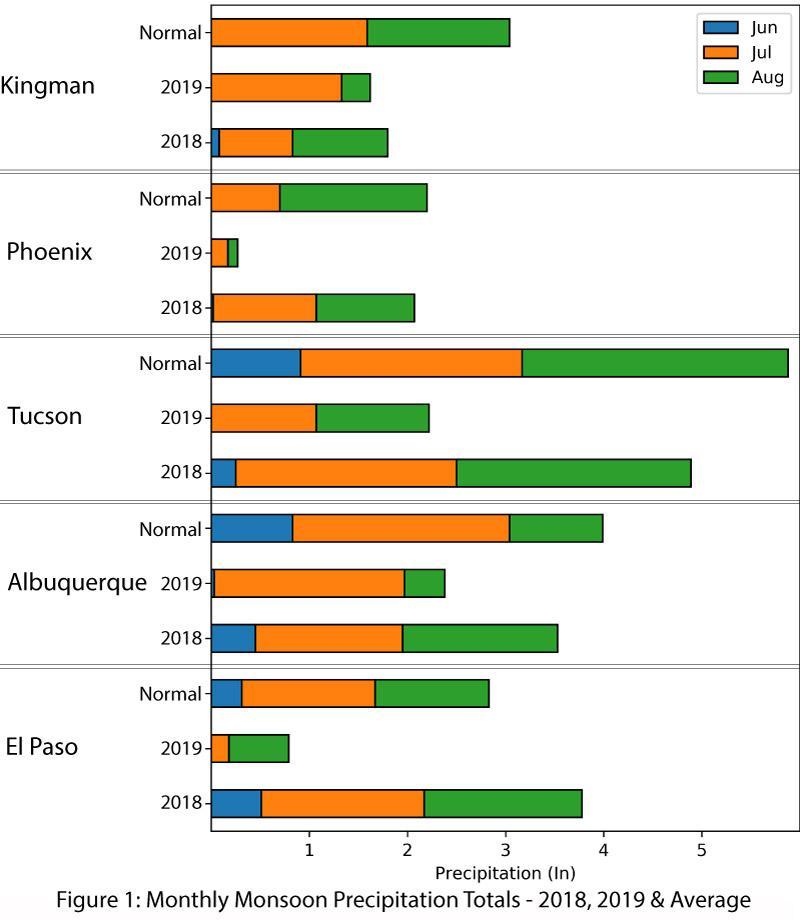
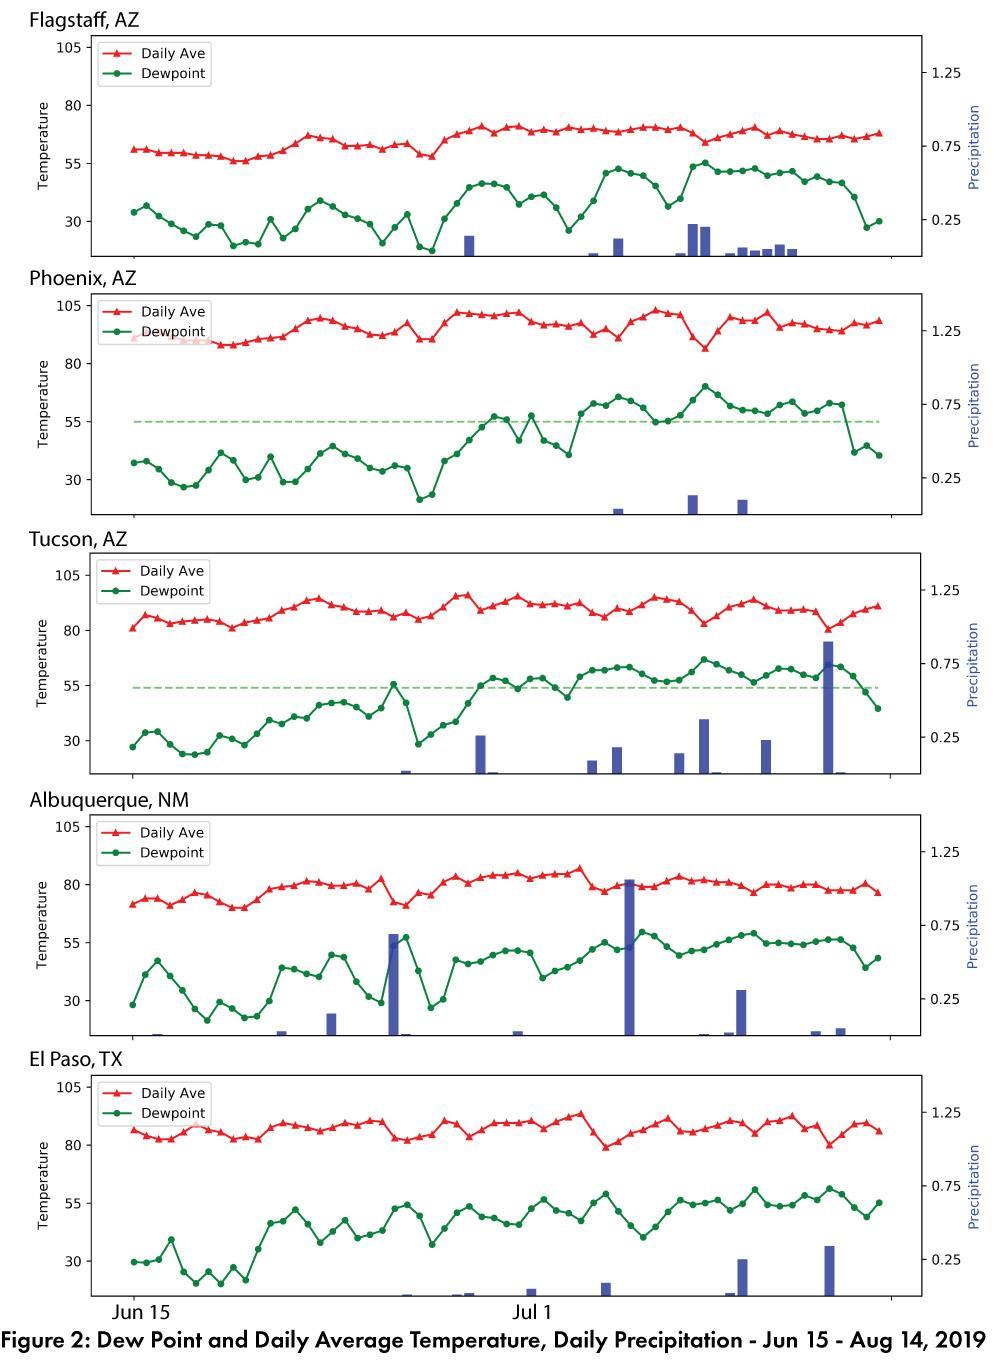
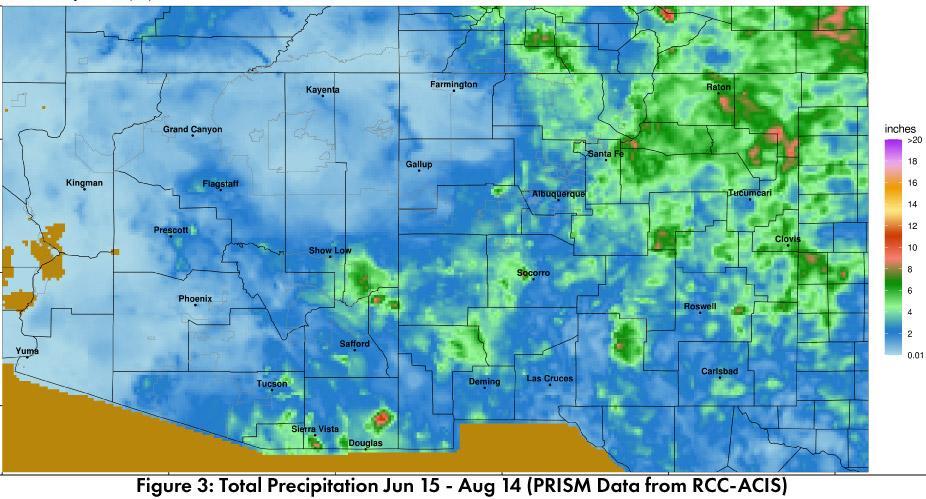
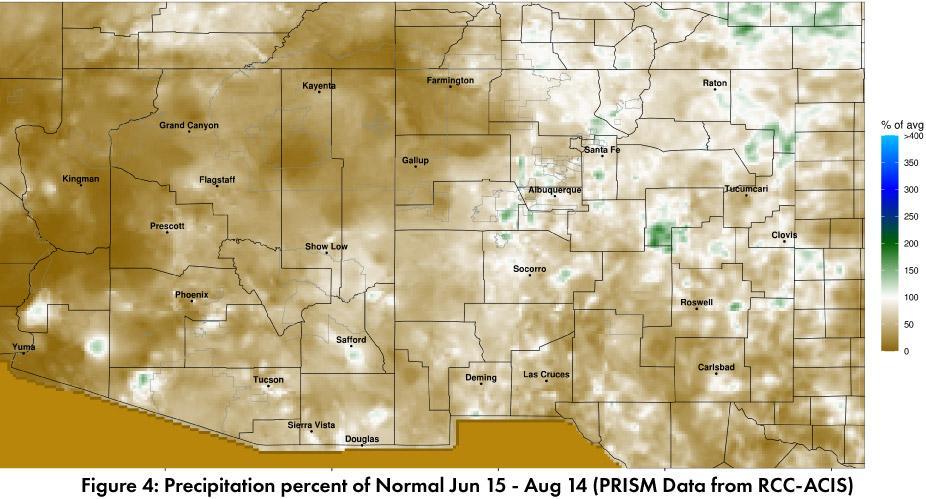
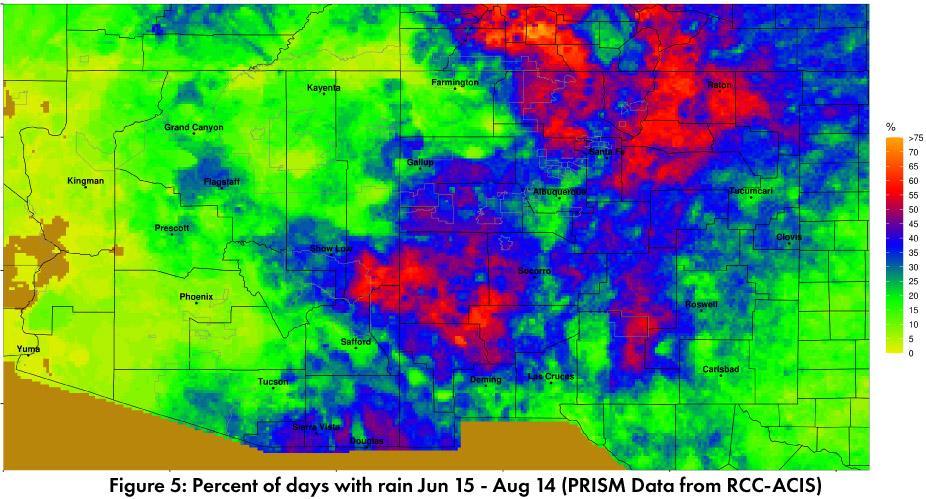
Given the spatial variability of the monsoon, single weather stations are an imperfect measure, but they do provide an opportunity to track long term averages compared to the current year. Figure 1 compares 2019 precipitation to date with 2018 and climatology. This reveals 2019 is lagging behind average in terms of precipitation and is also a significant departure from 2018’s widespread activity by mid-August. Dewpoint temperatures and daily precipitation for the same five stations (Fig. 2) illustrate that while increased dewpoint temperatures do not guarantee monsoon precipitation, it is rare to see monsoon precipitation in the absence of these elevated dewpoint temperatures. Regional monsoon precipitation totals (Fig. 3) demonstrate variable precipitation in the Southwest, with much of the region lagging behind average accumulated precipitation through mid-July (Fig. 4). Percent of days with rain highlight areas with more regular rainfall events (Fig. 5). Mid-August is the approximate monsoon midpoint*, so there is time for below average areas to catch up, since a relatively late start does not necessarily mean decreased activity over the entire monsoon.
Online Resources
- Figures 1-2 - Climate Assessment for the Southwest - climas.arizona.edu
- Figures 3-5 - Climate Science Applications Program - cals.arizona.edu/climate/misc/SWMonsoonMaps/current/swus_monsoon.html

