La Niña Tracker - Jan 2017
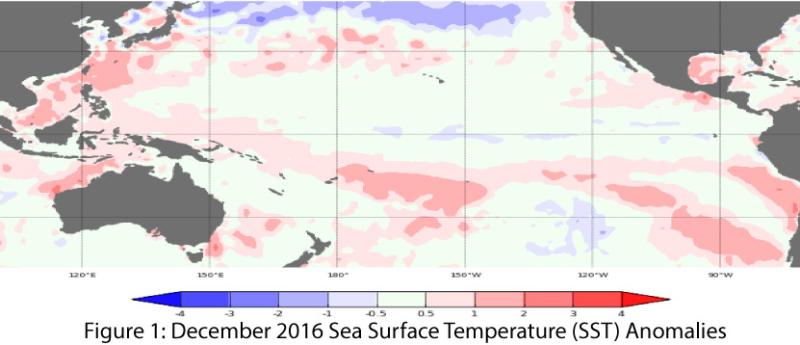
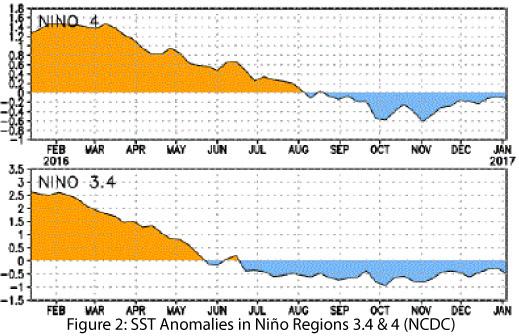
Oceanic and atmospheric indicators of the El Niño-Southern Oscillation (ENSO) continue to indicate weak La Niña conditions that are in rapid decline. Most forecast agencies identified a likely end to La Niña conditions (and by extension, this La Niña event) by February. This is not surprising given many of the oceanic and atmospheric indicators of La Niña have been weak to borderline neutral for much of the last few months (Figs. 1-2).
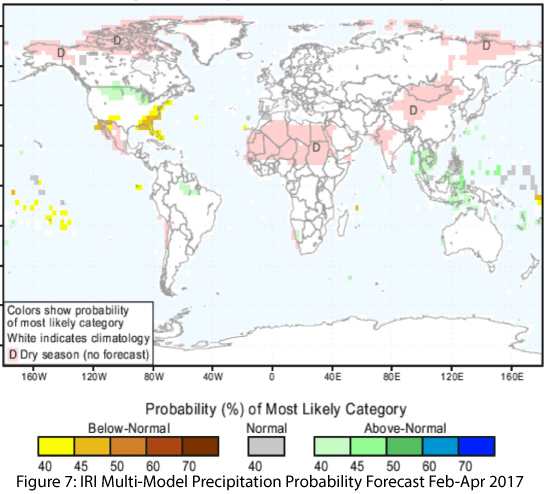
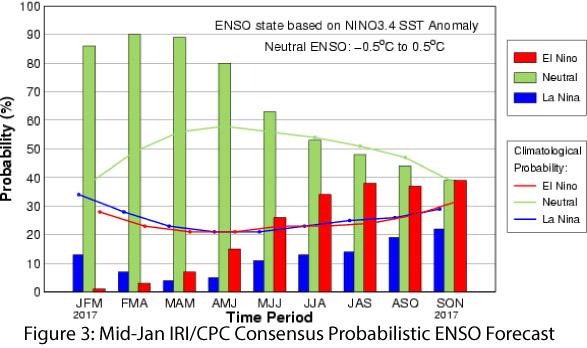
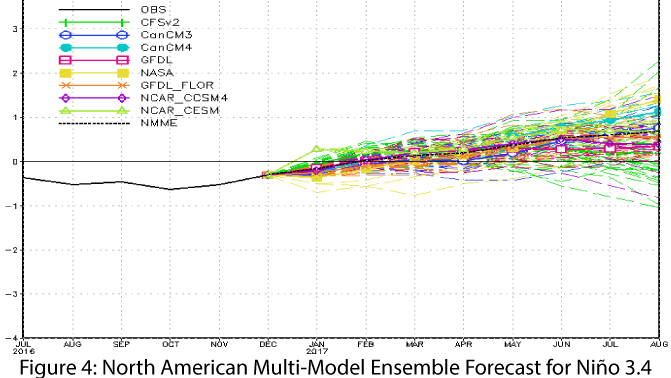
A closer look at the forecasts and seasonal outlooks continues to provide insight into the range of predictions for La Niña and its decline this winter. On Jan. 11, the Japanese Meteorological Agency declared the La Niña event was winding down, with a 70 percent chance of ENSO-neutral conditions through spring. On Jan. 12, the NOAA-Climate Prediction Center (CPC) maintained its La Niña advisory, based on oceanic and atmospheric conditions during December, and forecast a transition to ENSO-neutral conditions by February. On Jan. 17, the Australian Bureau of Meteorology continued the inactive status for its ENSO outlook, seeing currently neutral conditions with “little sign of El Niño or La Niña developing in the coming months.” On Jan. 19, the International Research Institute for Climate and Society (IRI) and CPC forecast this La Niña event will end by spring (Fig. 3), with global precipitation forecasts reflecting ENSO-neutral conditions (see Fig. 7 on p. 4). The North American Multi-Model Ensemble (NMME) characterizes the current model spread and highlights the variability looking forward to 2017. The NMME mean already has risen above the La Niña threshold in the current run and is forecast to remain ENSO-neutral through the first half of 2017 (Fig. 4).
Based on established criteria, a weak La Niña event started in fall 2016 and is nearly over as of mid-January. This event never locked in or escalated in strength, but instead wavered around the categorical distinction between weak La Niña and ENSO-neutral conditions, highlighting the difficulty in classifying borderline conditions into a categorical designation. The line between a weak ENSO event (La Niño or El Niño) and ENSO neutral conditions is relatively straightforward (i.e., the conditions are met or not), but the effect that a weak ENSO signal has on regional precipitation and temperature is less clear cut.
 In the Southwest, a La Niña event is more likely than not to bring warmer- and drier-than-average conditions to the Southwest over the cool season. La Niña years cluster on the dry end of seasonal precipitation distributions (Fig. 5), but weak La Niña events have a weaker relationship to reduced seasonal precipitation. In addition, southwestern winters are relatively dry in the first place, so a weak La Niña event might not even stand out compared to normal seasonal variation. On the other hand, a reduction in regional and western snowpack could have impacts on regional streamflow and reservoir storage going into the spring and summer, so the tendency for La Niña events to veer dry added to concern about the ongoing drought going into this event.
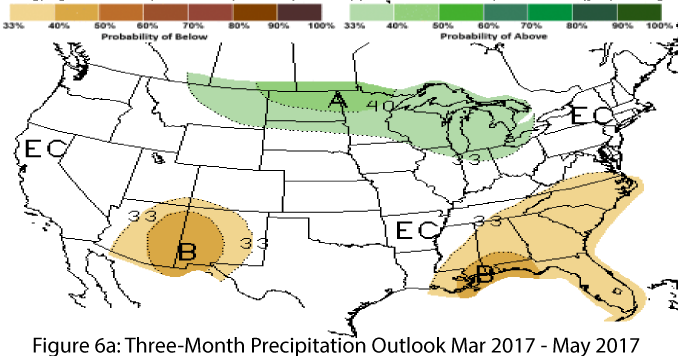
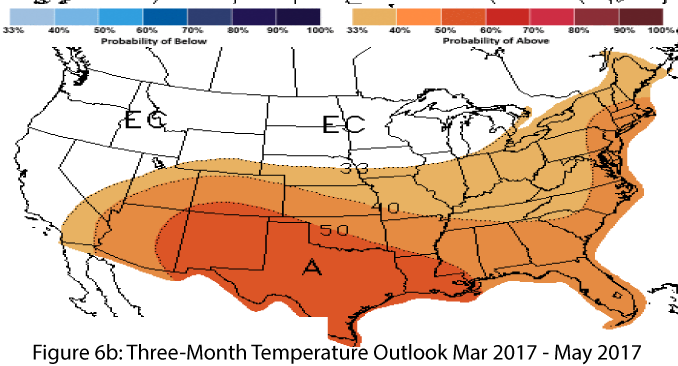
The monthly and seasonal forecasts likely have been incorporating the influence of La Niña into their projections, and for as long as this La Niña event persists, even in a weak form, we can expect these forecasts will continue to suggest warmer- and drier-than-average conditions (Figs. 6a–b, 7). Whether the season actually adheres to these forecasts is another story –last year’s El Niño event was a bit of a dud in the Southwest. In a paradoxical twist, recent precipitation events in the West have caused some to joke about this La Niña doing a great El Niño impersonation. The mechanisms are different, even if some unexpected patterns are shaping out in the short term. It remains to be seen how seasonal totals come together, along with the role that elevated temperature might play in altering snowpack and water storage over winter, with downstream impacts on water resource management over the coming months and years.
Figure Credits:
- Figure 1: Australian Bureau of Meteorology - http://www.bom.gov.au/climate/enso/index.shtml
- Figure 2: NOAA - National Climatic Data Center - http://www.ncdc.noaa.gov/teleconnections/enso/
- Figure 3: International Research Institute for Climate and Society - http://iri.columbia.edu/our-expertise/climate/forecasts/enso/
- Figure 4: NOAA - Climate Prediction Center - http://www.cpc.ncep.noaa.gov/
- Figure 5: Climate Science Applications Program - http://cals.arizona.edu/climate
- Figures 6a-b: NOAA - Climate Prediction Center - http://www.cpc.ncep.noaa.gov/
- Figure 7: IRI - International Research Institute for Climate and Society - http://iri.columbia.edu/

