Climate and Floods in the Southwest
Despite the Southwest’s arid climate, rivers in the region are not immune to overflowing their banks and flooding city streets, farms, and desert. Climate change likely will increase both flash floods and regional floods, making the region’s growing population more susceptible to losses of life and property.

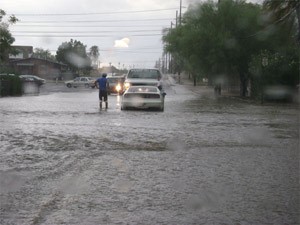
Summer flood event in Tucson, Arizona
Credit: Ashley Coles, The University of Arizona
One example of destructive flooding occurred during the winter of 1992–93, when vigorous storm activity drenched Arizona. Storms from the western Pacific built up snow packs in the higher elevations and saturated soils throughout the state. Streams and rivers topped their banks—peak flows on the Salt and Verde rivers surpassed their historical records. On the Gila River, billions of gallons of water poured over the Painted Rock Dam, flooding an estimated 10,000 acres of farmland and forcing several thousand people from their homes. Newspapers declared the economic burden of the flooding to be in the neighborhood of 50 million dollars.
How climate change alters future floods remains an open-ended question. However, recent observations and research are contributing to a better understanding of flooding in the Southwest, including:
- Causes of floods in the Southwest
- Trends in extreme precipitation and flooding in the Southwest
- Effects of future warming on floods
Causes of floods in the Southwest
Flooding causes more deaths in the United States than any other weather-related hazard except severe heat. In Arizona and New Mexico, floods killed 57 people between 1995 and 2006, while hundreds of others needed swift water rescues. The economic price tag is also high, costing Arizona, New Mexico, Colorado, and Utah approximately $5 billion between 1972 and 2006.

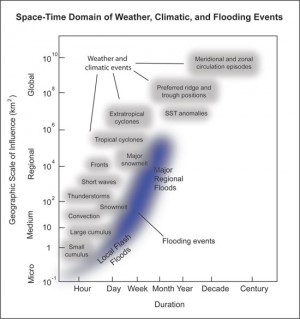
Figure 1. Space-time domain of weather, climatic, and flooding events.
| Enlarge This Figure |
Credit: Katie Hirschboeck, The University of Arizona
Storms may produce flooding on one river while not on another. The link between precipitation and flooding is complex and controlled by several factors, including soil moisture, the intensity and duration of the precipitation event, and the area and steepness of the watershed.
Flooding in the Southwest primary results from three storm types: winter frontal storms that cover a large in area and frequently occur between late November and mid-March; dissipating tropical cyclones moving north from the Pacific Ocean that occur between late summer and early fall; and convective thunderstorms that form during the monsoon season between late June and mid-September.3 These storms also influence the duration of flooding, with more regional events causing long-lasting floods (Figure 1).
Regional floods often accompany slow-moving, low-pressure weather systems such as decaying tropical storms or winter frontal systems. Regional floods also occur when rain combines with melting snow. In these circumstances, frozen ground acts as an impervious layer and both rain and snowmelt flow quickly and in greater quantities into rivers, much like the flooding in the winter of 1993.
Flash floods can occur within seconds to hours after the onset of a rain storm. They can be deadly because they rapidly increase water levels and flow with a devastating swiftness. Urban areas are particularly susceptible to flash floods because a high percentage of the surface area is covered by impermeable streets and buildings; runoff occurs very rapidly because the water cannot sink into the ground. Mountainous areas also experience flash floods, as steep topography funnels water into canyons and gullies—a flash flood in Sabino Canyon in Tucson, Arizona, killed eight people in 1981.
Trends in extreme precipitation and flooding in the Southwest
The largest flood in the 75-year instrumental record of Sabino Creek in Tucson occurred in July 2006. During this event, the swollen waters of Sabino Creek joined the already raging Rillito River, typically an ephemeral wash carving through Tucson’s urban landscape, and flooded roads and bridges, destroying property.

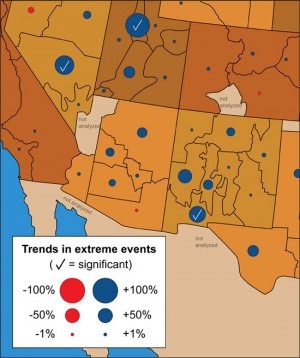
Figure 2. Trends in the frequency of precipitation events in which precipitation over a 7-day duration exceeds a 1-year recurrence interval for each particular climate division. Blue circles are positive trends, red circles are negative trends. The magnitude of the trend is linearly proportional to the radius of the circle. A 100% trend is equal to a doubling of the average yearly frequency, from 1 to 2 events per year. Check marks indicate positive trends with a local significance at the 5% level.
| Enlarge This Figure |
Credit: Kenneth Kunkel5, Desert Research Institute
The magnitude of floods like these seems to be increasing, according to analysis of historic data for Sabino Creek. The analysis shows that the volume of water for large floods measured at the mouth of the creek has risen consistently over the past 75 years. The authors suggest that climate change is likely the cause for the increase in the size of floods because land change has not occurred in this basin during the period of record. This trend will likely continue if global warming increases atmospheric moisture as projected.
In a broader study that analyzed precipitation records for the U.S. and Canada, the authors found increasing trends for extreme precipitation events in the Southwest from 1931 to 1996 (Figure 2). In this study, the authors investigated the number of events in which the seven-, three-, and one-day precipitation totals for each climate station surpassed a threshold. The threshold was defined as the total precipitation in seven-, three-, and one-day events that would occur only once per year. The authors found that the number of events exceeding the threshold has been increasing in most climate divisions. In southwestern New Mexico, for example, the number of events per year has nearly doubled from one to two since 1931.
Effects of future warming on floods
While the Southwest is expected to become warmer and drier, it paradoxically is likely to see more flooding. This relates in part to the fact that warm air holds more moisture than cooler air. The frequency of floods is also influenced by the rate of snowmelt in the winter and spring, the character of the summer monsoon, and the incidence of tropical hurricanes and storms in the fall.
Snowpack measurements suggest that rising temperatures are melting winter snow progressively earlier in the year and causing streamflows to deliver water to reservoirs and users in greater quantities earlier in the spring season. Historically, snowmelt has occurred at the same time people ramp up their water consumption, which has drained reservoirs as they fill. When streamflows become elevated earlier in the year, however, reservoirs fill more quickly. Earlier future streamflows will likely increase the chance that spikes in river flows occur when the reservoirs are at full capacity, and therefore increase the probability of these types of floods.
Average air temperatures are rising, and it is likely that continued warming will accentuate the temperature difference between the Southwest and the tropical Pacific Ocean, enhancing the strength of the southwesterly winds that carry moist air from the tropics into the Southwest during the monsoon. This scenario may increase the monsoon’s intensity, or its duration, or both, in which case floods will occur with greater frequency.
Hurricanes and other tropical cyclones are projected to become more intense in the future.6 Since Arizona and New Mexico typically receive 10 percent or more of their annual precipitation from tropical storms, it is likely that this change will also increase flooding.
References
- National Oceanic and Atmospheric Administration: Office of Climate, Water, and Weather Services. 2009. Weather Fatalities. http://www.weather.gov/os/hazstats.shtml (last accessed on April 21, 2009).
- Changnon S.A. 2008. Assessment of flood losses in the United States, Journal of Contemporary Water Research & Education, 138:38-44.
- House, P.K. and V.R. Baker. 2000. Paleohydrology of flash floods in small desert watersheds in western Arizona. Water Resources Research, 37:1825-1839.
- Desilets, D. and S.L. Desilets. 2006. Magnitude of flash floods on the rise in the Sabino Creek. Arizona Geophysical Union, Fall Meeting 2006, abstract with programs: H21B-1369.
- Kunkel, K.K., and K. Andsager. 1999. Long-term trends in Extreme Precipitation Events over the Conterminous United States and Canada. Journal of Climate, 12:2515–2527.
- Trenberth, et al. 2007. Summary for policymakers. In: Climate Change 2007: The Physical Science Basis. Contribution of Working Group I to the Fourth Assessment Report of the Intergovernmental Panel on Climate Change. [Solomon, S., D. Qin, M. Manning, Z. Chen, M. Marquis, K.B. Averyt, M.Tignor and H.L. Miller (eds.)].Cambridge University Press, Cambridge, United Kingdom and New York, NY, USA.
- Lenart, M. 2006. East Pacific hurricanes bring rain to Southwest. In Lenart, M. (ed.) Global warming in the Southwest: Projection, observations, and impacts. University of Arizona, Climate Assessment of the Southwest, Tucson, Arizona.
