Southwest Climate Outlook March 2018 - Climate Summary
From the March 2018 issue of the CLIMAS Southwest Climate Outlook
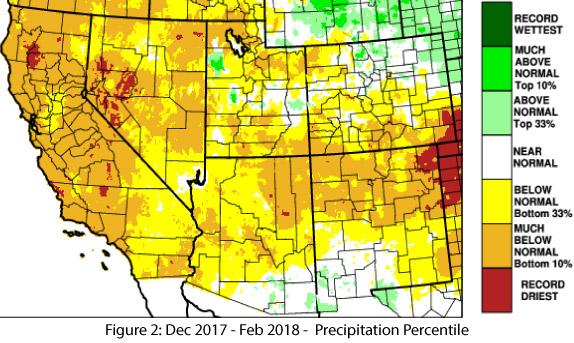
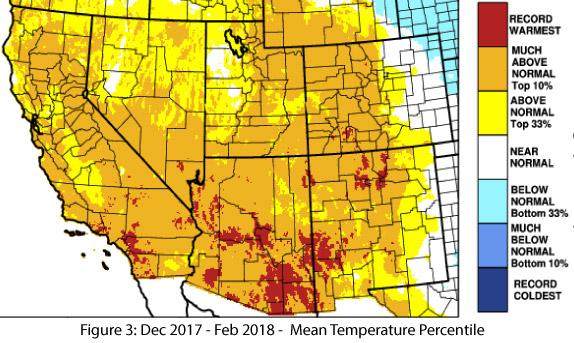
Precipitation & Temperature: Precipitation varied considerably across the Southwest in February, but temperatures remained warm throughout the region. Precipitation amounts ranged from below average to much-above average, with the wetter areas concentrated in southern Arizona and southwestern New Mexico and the driest areas occurring in the Four Corners region and northeastern New Mexico (Fig. 1a). Temperatures ranged from average to above average in Arizona, and from above average to much-above average in New Mexico (Fig. 1b). Dec-Feb (DJF) precipitation was mostly below normal to much-below normal, with isolated areas of record-driest precipitation (Fig. 2). DJF temperatures were much-above normal to record warmest in Arizona and near normal to record warmest in New Mexico (Fig. 3).
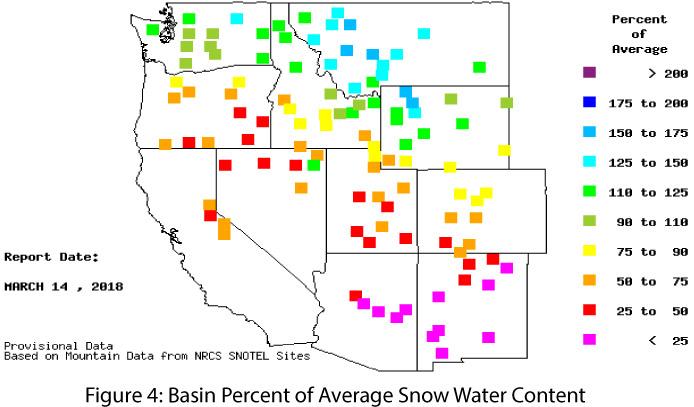
Snowpack & Water Supply: Snowpack and snow water equivalent (SWE) have increased marginally over last month owing to increased winter storm activity. Even so, most of the stations in Arizona and New Mexico are reporting less than 25 percent of average, with the remainder reporting 25-50 percent of average (Fig. 4). The higher-elevation regions in Colorado and Utah that feed many of our waterways are not faring much better, with most stations reporting SWE of 25-75 percent of average. These data raise concerns about drought impacts on reservoir storage levels, rangeland and agricultural conditions, and wildfire risk going into the spring and summer seasons.
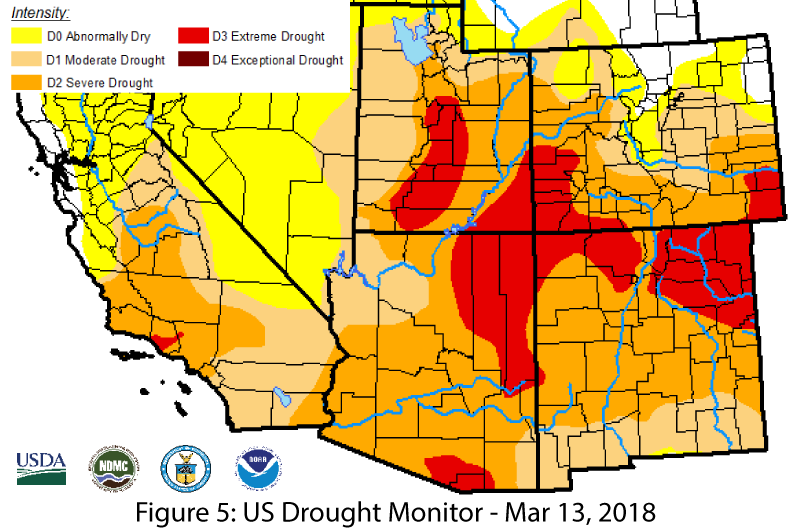
Drought: Drought-designated areas were further expanded and intensified in the March 13 U.S. Drought Monitor, with both Arizona and New Mexico documenting increases in the extent and intensity of drought since February’s outlook. The predominant classification in both states was severe drought (D2), while the remainder was a roughly equal mix of extreme drought (D3) and moderate drought (D1) (Fig. 5). These designations reflect short-term precipitation deficits and warm temperatures at monthly and seasonal timescales, as well longer-term drought conditions that track the cumulative effect of extended periods of warmer- and drier-than-normal conditions. February clawed back some of the precipitation deficit that accumulated over the previous weeks and months, but isolated events are unlikely to reverse longer-term trends or alleviate long-term drought and its impacts.
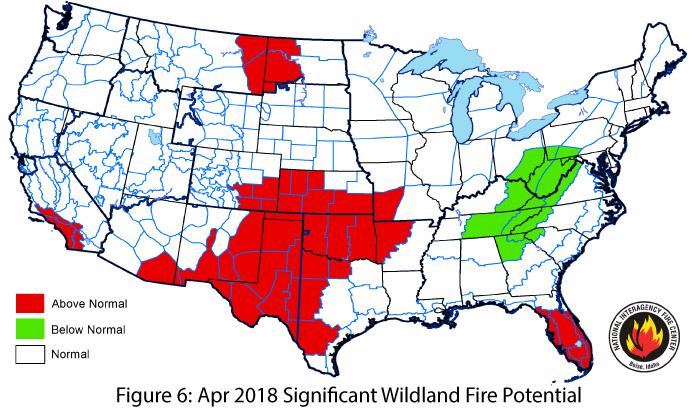
Wildfire: The National Significant Wildland Fire Potential Outlook for April identified above-normal wildland fire risk for eastern New Mexico and the borderlands region in New Mexico and southeastern Arizona (Fig. 6). The above-normal fire risk expanded to include nearly all of Arizona and New Mexico in May and June. Warm and dry conditions this winter, in conjunction with above-normal fine-fuel loading and continuity, are major drivers of the elevated risk.
ENSO & La Niña: Oceanic and atmospheric conditions are still generally indicative of a La Niña event, but suggest a return to ENSO-neutral relatively soon. Most forecasts and outlooks call for a gradual decay to ENSO-neutral over spring, although some agencies have already declared this La Niña event over (see ENSO tracker for details). La Niña events tend to produce warmer- and drier-than-average winters in the Southwest, which is consistent with the DJF temperature and precipitation patterns observed this year.
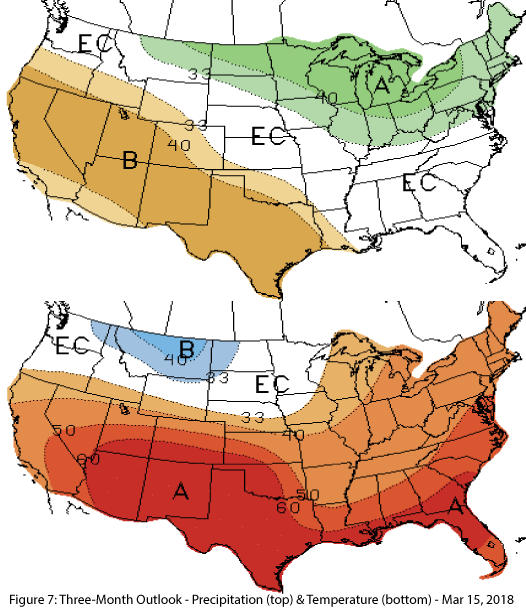
Precipitation & Temperature Forecast: The three-month outlook for March through May calls for increased chances of below-average precipitation (Fig. 7, top) and increased chances of above-average temperatures (Fig. 7, bottom) for the southwestern United States.
- Figure 1 - National Centers for Environmental Information - ncei.noaa.gov
- Figures 2-4 - Western Regional Climate Center - wrcc.dri.edu
- Figure 5 - U.S. Drought Monitor - droughtmonitor.unl.edu
- Figure 6 - National Interagency Fire Center - nifc.gov
- Figure 7 - NOAA - Climate Prediction Center - cpc.ncep.noaa.gov


