Regional Climate Overview - February | March | April
Temperatures over the past three months (February-April) were 2-5 °F (1.1-2.8 °C) above average for most of New Mexico and the southern half of Texas (Figure 1; left). Temperatures were 0-3 °F (0-1.7 °C) below average for North-Central Texas. Precipitation over the same time period was 0-50% of average for most of New Mexico and the western half of Texas, and 90-130% of average for Southwest New Mexico and East Texas (Figure 1; right). Weakening La Niña conditions in the tropical Pacific are likely responsible for the precipitation gradient from west-to-east.
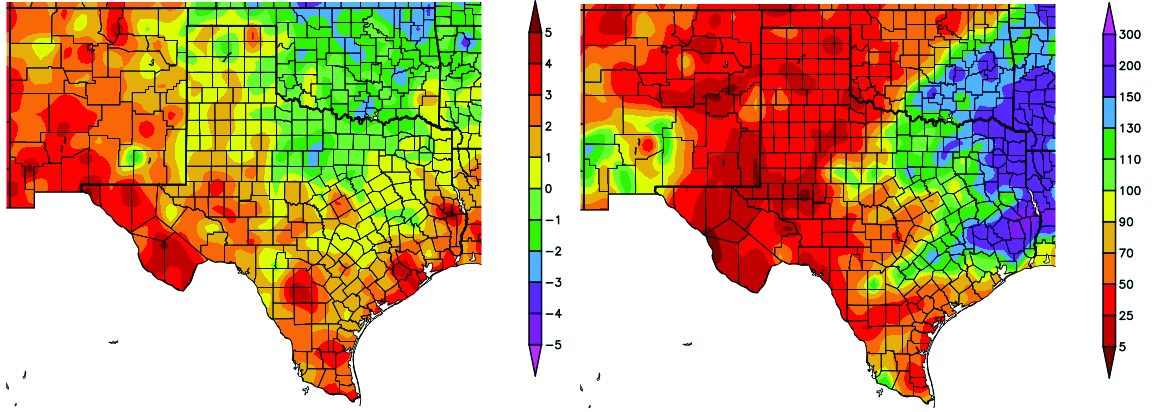 Figure 1 (above): Departure from average temperature in degrees F (left) and percent of average precipitation (right), compared to the 1981–2010 climate average, for 2/1/2018–4/30/2018. Maps from HPRCC.
Temperatures from May 1-14 were 8-10 °F (4.4-5.5 °C) above average in most of western New Mexico and North Texas, and 4-6 °F (2.2-3.3 °C) above average throughout the rest of New Mexico. Small pockets along the southern Rio Grande border in Texas experienced temperatures 0-2 °F (1.1-2.2 °C) below average (figure not shown). Precipitation over the same time period was 0–50% of average for most of New Mexico and West Texas. Some areas in Central and southern Texas received precipitation 150-400% of average.
The beginning of the year continues to be warmer than normal for most of northern Mexico. Colder than normal regions were concentrated in the middle part of the Baja California Peninsula, Sonora and in pockets of Southwest Chihuahua. The most extreme positive anomalies, greater than 9°F (5°C), were over North-central Chihuahua and western Durango (Figure 2, left). Greater number of days with minimum temperature lower than 0°C, more than 50 days, were located in northern Durango and western Chihuahua. The footprint between 1 and 10 days at or below 0°C was reduced compared to previous months, mainly in northern Sonora, Chihuahua and Coahuila (Figure 2, right).
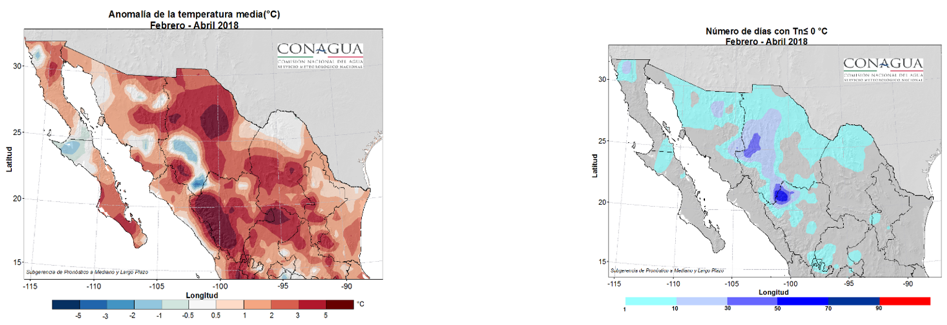 Figure 2 (above): Temperature anomalies in °C (left) and number of days with minimum temperatures at or below 0 °C (32 °F) (right) for February–April. Maps from SMN.
There was a recovery of moisture in northwestern Mexico in the past three months. The largest amounts of rainfall exceeded 100 mm in most of southern Tamaulipas and northern Sonora (Figure 3, left). Northern Sonora, Sonora-Chihuahua-Sinaloa border, and a wide region from the Central Basins to the Northeast observed above normal precipitation during this last three-month period (Figure 3, right).
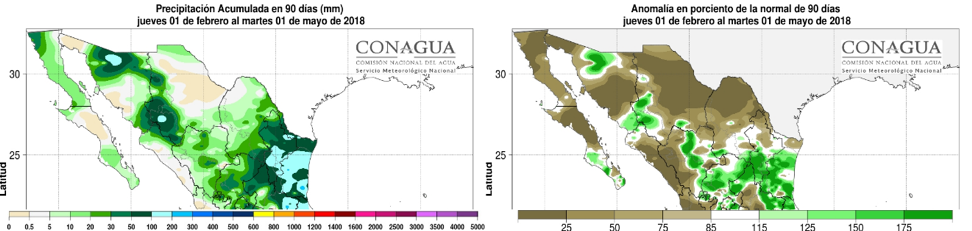 Figure 3 (above): Accumulated precipitation in mm (left) and percent of normal (right) for February–April. Maps from SMN.
Drought
Drought conditions intensified across the region over the past month, as below-average precipitation and above-average temperatures persisted, according to the North American Drought Monitor (NADM) (Figure 4). Exceptional drought conditions have developed in northern New Mexico and expanded in North Texas. Extreme drought conditions developed along the Texas-Coahuila border, and moderate to severe drought conditions remain in southern New Mexico, West Texas, and the northern areas of the Mexico border states. Conditions are predicted to persist through August in most of New Mexico and areas in western and southern Texas, and drought development is likely in South-Central Texas. Drought conditions are predicted to remain, but improve, in northern Texas and eastern New Mexico, according to the U.S. Seasonal Drought Outlook.
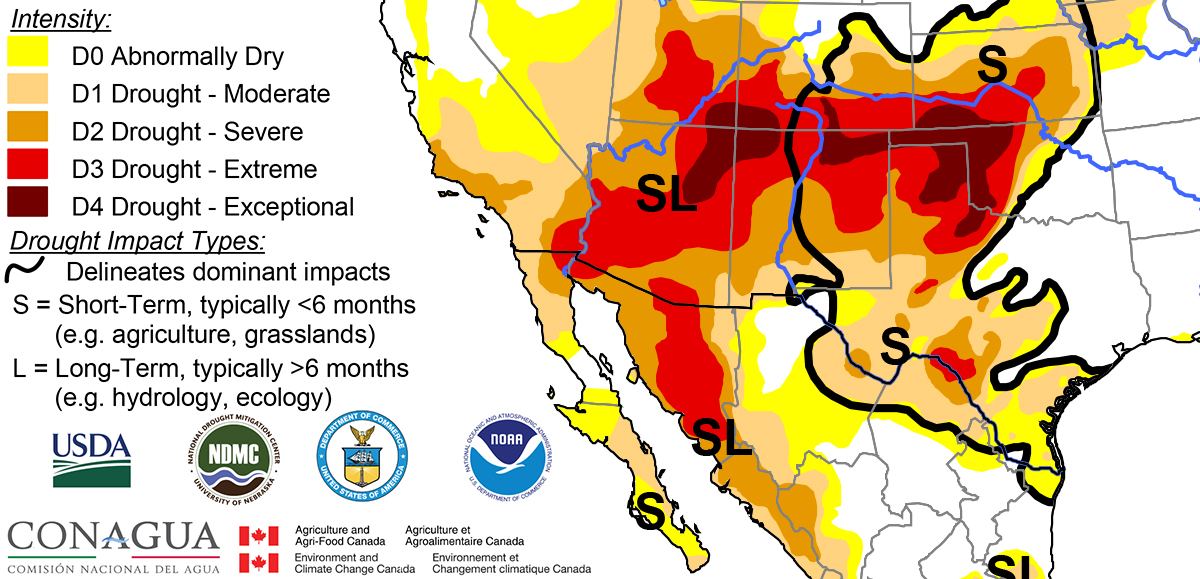 Figure 4 (above): North American Drought Monitor, released May 10, 2018.