Regional Climate Overview - May | June | July
Temperatures over the past three months (May-July) were 2-6 °F (1.1-3.3 °C) above average for most of New Mexico and Texas (Figure 1; left). Precipitation over the same time period was well below average for most of both states, except for the southern tip of Texas which received precipitation 150-300% of average, mostly due to a slow-moving low-pressure system on June 18-21 that dropped record-setting rainfall and resulted in widespread flooding (Figure 1; right). Near Premont, TX, the rain gauge reached its capacity at 11 inches before overflowing (NOAA State of the Climate).
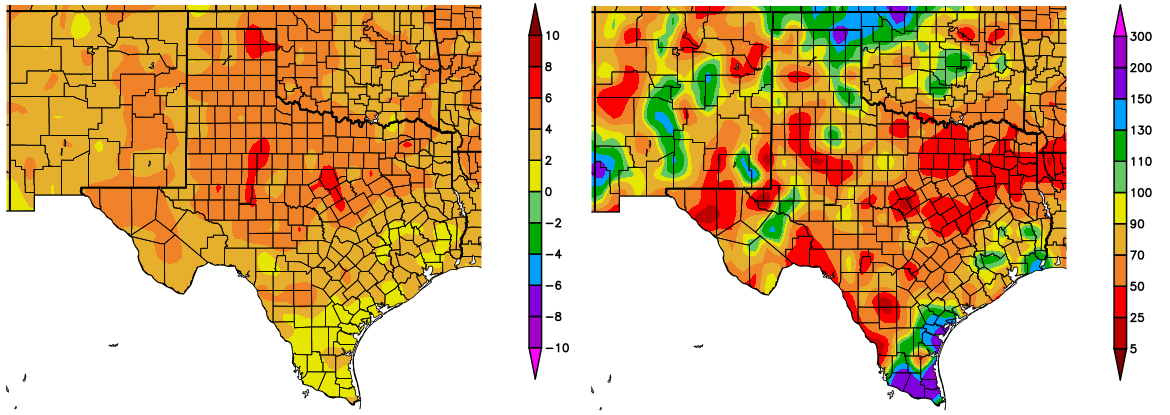 Figure 1 (above): Departure from average temperature in degrees F (left) and percent of average precipitation (right), compared to the 1981–2010 climate average, for 5/1/2018–7/31/2018. Maps from HPRCC.
From January-July, New Mexico experienced record warm average and maximum temperatures. Texas temperatures were much above average. In Texas during July, there were several reports of strong wind gusts across the state, including an 82-mph gust on July 13th, reported at the El Paso International Airport, Texas (NOAA State of the Climate). Monsoon storms led to flooding in the Southwest. In San Antonio, New Mexico on July 15th, about 20 homes were damaged by flash floods.
Temperatures from August 1-15 were 0-3 °F (0-1.7 °C) above average in most of New Mexico and westernmost Texas, while the rest of Texas and easternmost New Mexico experienced temperatures 0-4 °F (0-2.2 °C) below average (figure not shown). Precipitation over the same time period was 0-50% of average for most of New Mexico and western, southern, and northern Texas, while Central Texas experienced precipitation 200-800% of average.
Northwest Mexico continued to experience below-average temperatures from May to July, with anomalies 0.9-1.8 °F (0.5-1.0 °C) below average for most of Sonora and southern Chihuahua. The rest of the northern part of the country was warmer than normal, with Chihuahua and Durango recording the largest positive anomalies (Figure 2, left). Parts of Chihuahua and Durango recorded more than 50 days with temperatures at or above 104 °F (40°C) in the period from May to July (Figure 2, right).
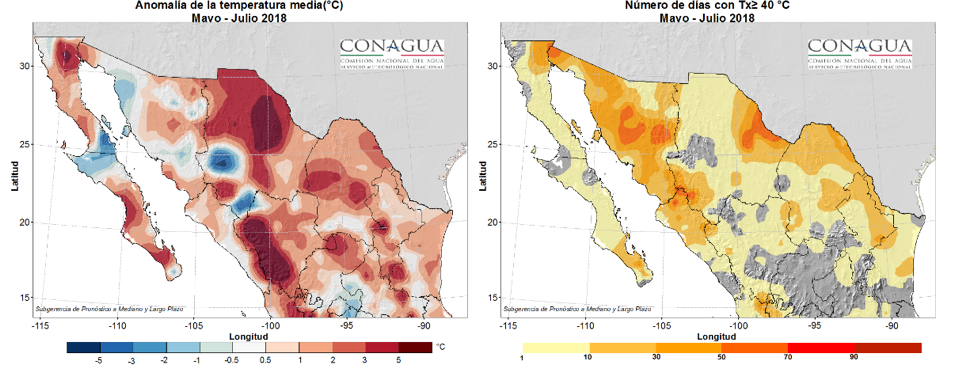
Figure 2 (above): Temperature anomalies in °C (left) and number of days with maximum temperatures at or above 104 °F (40 °C) (right) for May–July. Maps from SMN.
Precipitation from May to July remained above average in southern Sonora, western Chihuahua, and from Zacatecas to southern Nuevo León. The highest rainfall accumulations, around 20 inches (500 mm), fell over Nayarit (Figure 3, left). Below-average precipitation continued in most of the Baja California peninsula, in addition to a strip from Sinaloa to northern Coahuila. Southern Tamaulipas and eastern San Luis Potosí also experienced below-average precipitation (Figure 3, right).
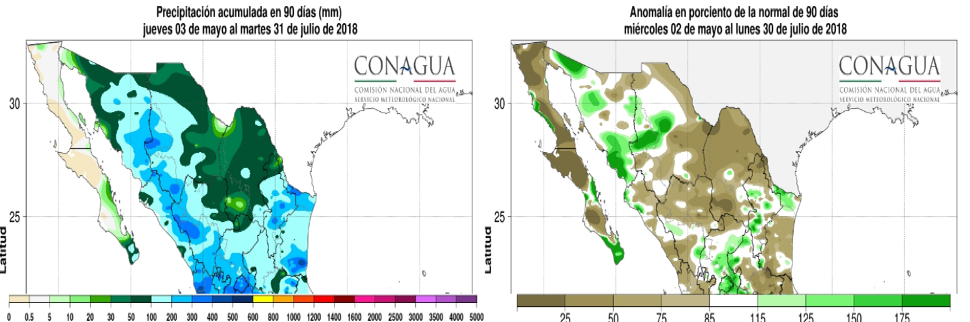
Figure 3 (above): Accumulated precipitation in mm (left) and percent of normal (right) for May–July. Maps from SMN.
Drought
Monsoon precipitation lessened drought conditions slightly in New Mexico over the past month, according to the North American Drought Monitor (NADM) (Figure 4). However, severe to exceptional drought still covers over half of the state. In Texas, severe to extreme drought conditions persist, mostly in the central and northern parts of the state, and near Laredo. In Mexico, abnormally dry conditions now exist in Chihuahua, Coahuila, and Tamaulipas. Moderate to extreme drought conditions persist in northern Coahuila and Nuevo León. Drought conditions are predicted to remain, but lessen in most of New Mexico and the Texas panhandle, by the end of November, according to the U.S. Seasonal Drought Outlook. In southern New Mexico, drought removal is likely during this time. For Central, Northeast, and Southwest Texas, drought conditions are predicted to persist.
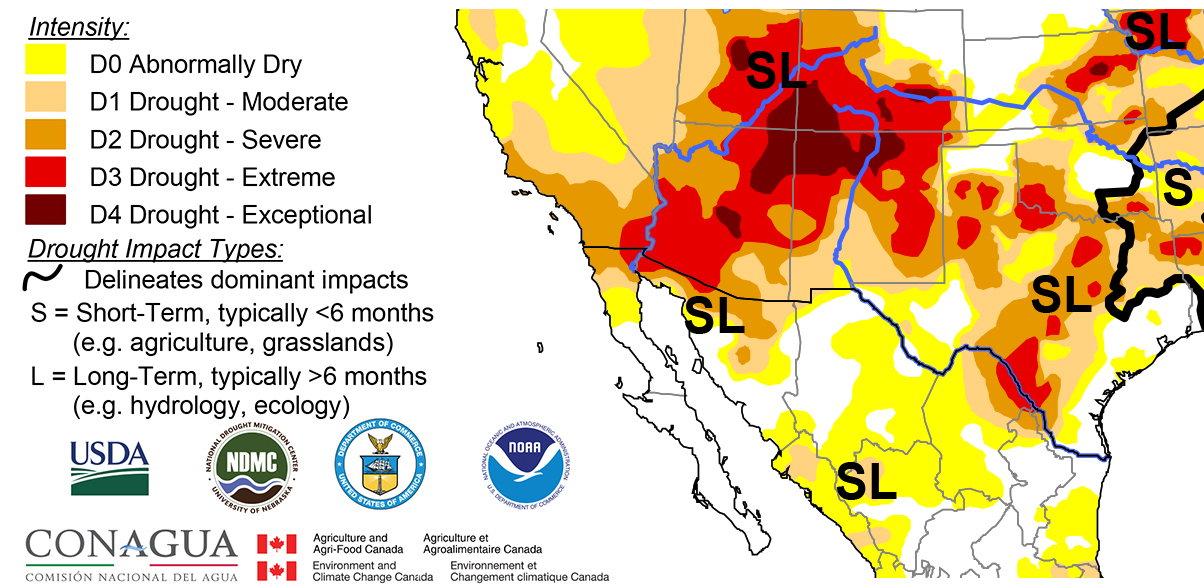 Figure 4 (above): North American Drought Monitor, released August 16, 2018.