Monsoon Tracker
Monsoon precipitation totals vary considerably across the Southwest. Monthly totals for select locations reveal near or below-average amounts compared to long-term averages (Fig. 15). There are widespread regions with above-average totals as well, revealing the challenge of characterizing monsoon performance using single stations. The monthly breakdown illustrates the sporadic nature of monsoon activity that affects how each locale reaches its seasonal totals and demonstrates how particular events can boost monthly totals in some locations but not others. Daily precipitation plots for the same stations (Fig. 16) further demonstrates the intermittent nature of monsoon precipitation and distinguishes areas that have had frequent events (e.g. Tucson, Flagstaff) from those with fewer ones (e.g. Phoenix, El Paso).
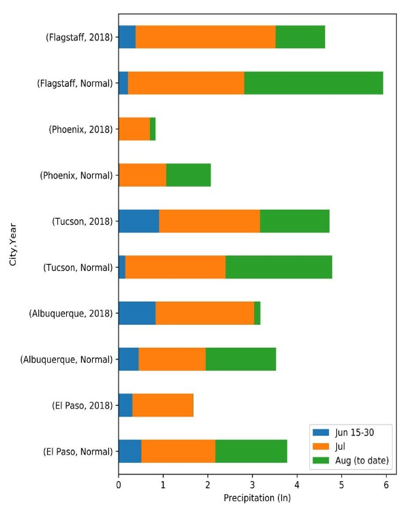
Figure 15 (above): Monthly monsoon precipitation totals – 2018 vs. average.
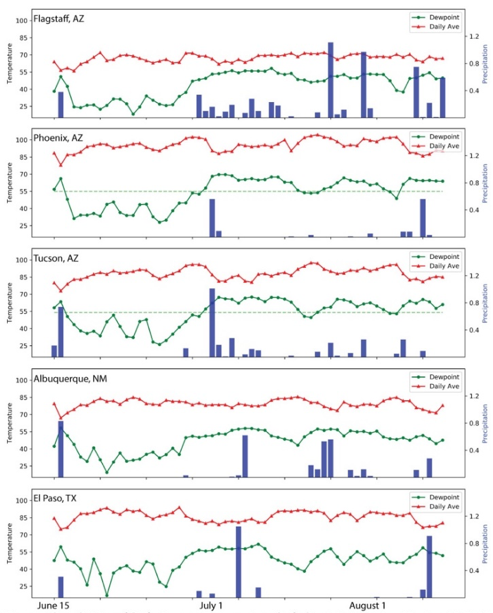
Figure 16: Dewpoint and daily average temperature, daily precipitation, June 15-August 13, 2018.
The seasonal totals and percent of average precipitation since July 19th (Fig. 17) and June 18th (Fig. 18) help characterize the spatial variability and intensity of the monsoon thus far. Looking at city totals as of August 17, Laredo, TX has only received 0.75 inches this monsoon, which is well below-average for the area. Meanwhile, nearby Del Rio, TX has received 6.85 inches, which is above average for the city, and half of which (3.6 inches) fell on one day, August 11. El Paso, TX and Albuquerque, NM have received close to average precipitation, and Santa Fe has received about 2.5 inches—below average for the city.
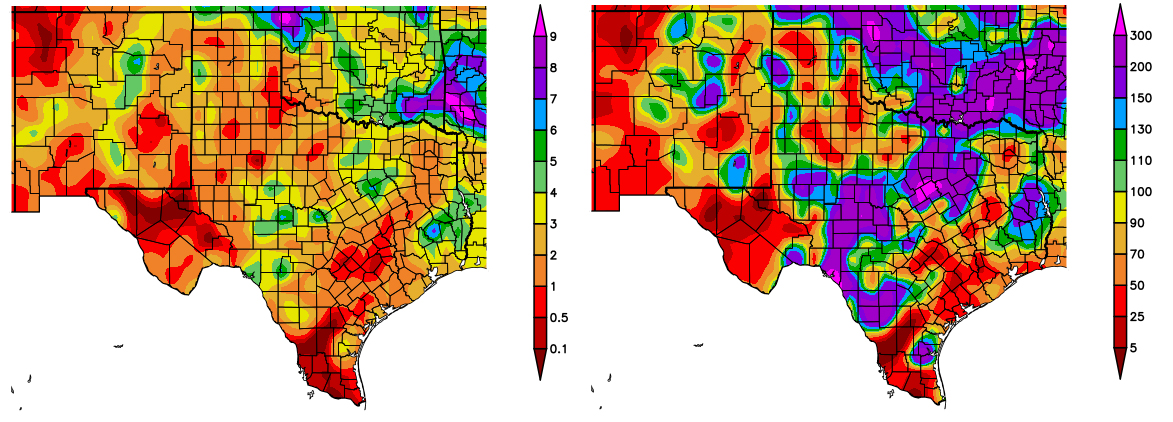 Figure 17 (above): Total precipitation (in inches) (left), and percent of average precipitation (right), for July 18-August 16. Maps from HPRCC.
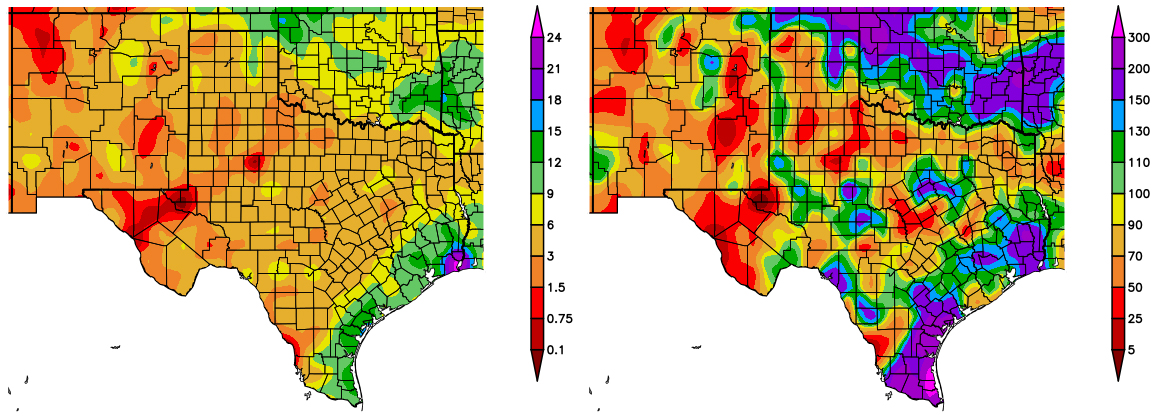 Figure 18 (above): Total precipitation (in inches) (left), and percent of average precipitation (right), for June 18-August 16. Maps from HPRCC.
As discussed last month, increasing dewpoint temperature was the old metric by which monsoon onset was determined. This year, the onset of monsoon precipitation was relatively closely aligned with increasing dewpoint temperatures in early July, but the precipitation/dewpoint relationship since then illustrates why elevated dewpoint is an imperfect measure of likely precipitation. Although dewpoint temperatures were elevated for much of the last month, precipitation was not consistent. In fact, sustained periods of high dewpoints without precipitation led to extreme heat warnings in the region, with heat indices over 110 degrees F in some locations, and persistent warm overnight temperatures. Without storm-induced cooling, elevated dewpoint temperatures can be downright miserable, especially for households that rely on evaporative coolers for interior climate control.
Additional Monsoon Resources:
• NWS: http://www.wrh.noaa.gov/twc/monsoon/monsoon_info.php
• CLIMAS: http://www.climas.arizona.edu/sw-climate/monsoon
• CONAGUA: http://www.gob.mx/conagua/prensa/inicio-el-monzon-de-norteamerica-en-el-noroeste-de-mexico