Regional Climate Overview - July | August | September
Temperatures over the past three months (July-September) were 1-3 °F (0.6-1.7 °C) above average for almost all of New Mexico and most of Texas (Figure 1, left). Precipitation over the same time period was 25-90 % of average for most of New Mexico and western and northern Texas (Figure 1, right). For the remainder of Texas, however, precipitation was 150-300% of average, mostly due to Tropical Storm Gordon in September, which was the wettest September on record for Texas. From January-September, New Mexico experienced record warm average temperatures (NOAA State of the Climate).
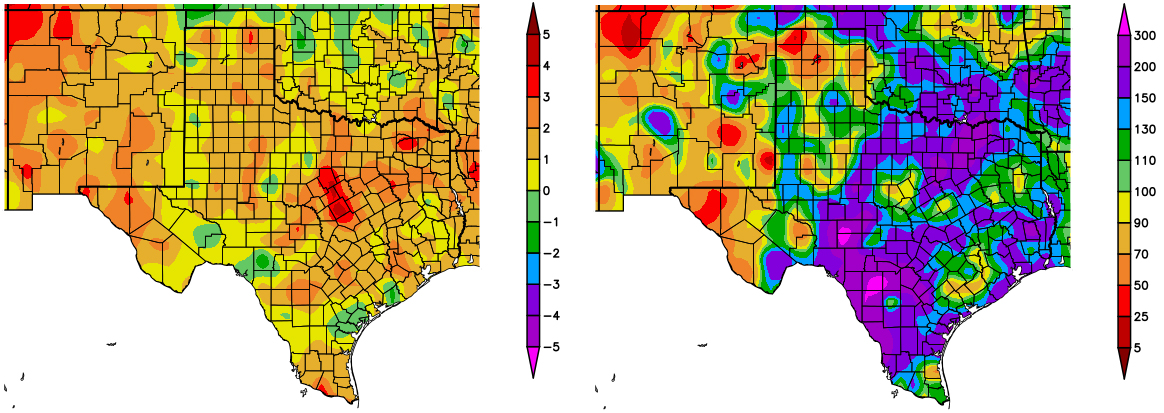 Figure 1 (above): Departure from average temperature in degrees F (left) and percent of average precipitation (right), compared to the 1981–2010 climate average, for 7/1/2018–9/30/2018. Maps from HPRCC.
Temperatures from October 1 through 17 were 0-4 °F (0-2.2 °C) below average in most of New Mexico and northern Texas, and 0-4 °F (0-2.2 °C) above average for eastern and southern Texas (figure not shown). Precipitation over the same time period was 200-800% of average for most of Texas and 100-200% of average for most of New Mexico, except for Central New Mexico where precipitation was 25-75% below average.
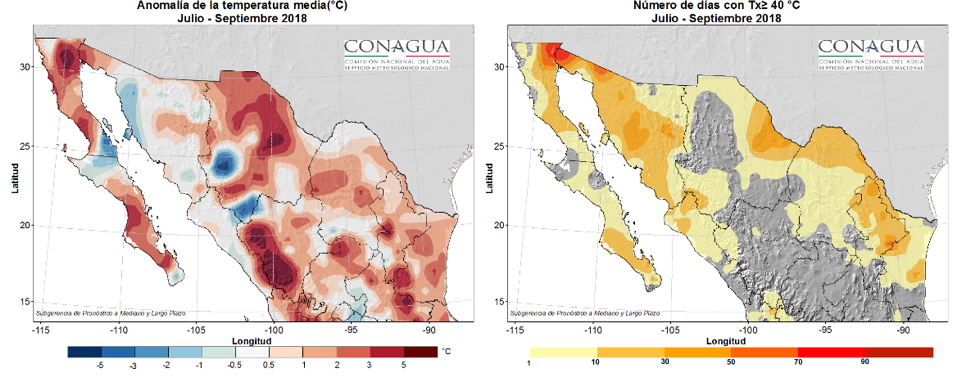
Figure 2 (above): Temperature anomalies in °C (left) and number of days with maximum temperatures at or above 104 °F (40 °C) (right) for July-September. Maps from SMN.
Temperatures were warmer than normal in most of the northern part of Mexico, with the exception of the Northwest where anomalies were around 1.8 °F (1.0 °C) below average. The highest positive anomalies exceeded 9 °F (5 °C) above average in western Durango and northern Chihuahua (Figure 2, left). The greatest number of warm days, more than 70 days above 104 °F (40 °C), were in the Mexicali-San Luis Rio Colorado area between Baja California-Sonora States. The area with more than 10 days above 104 °F (40 °C) spread to southern Sonora in the Northwest and in a large part of the Rio Grande/Bravo basin (Figure 2, right).
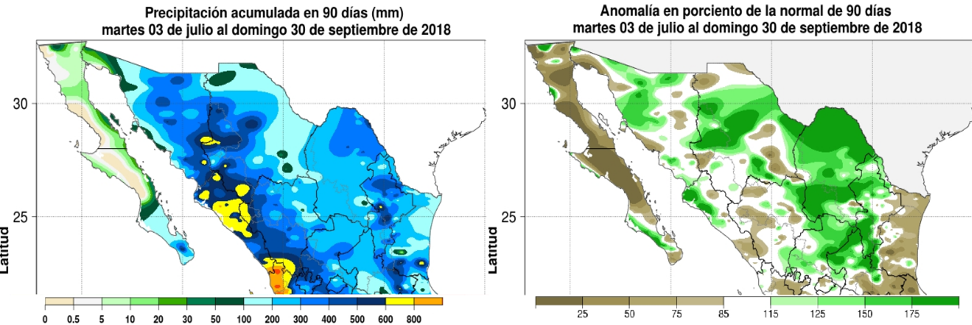
Figure 3 (above): Accumulated precipitation in mm (left) and percent of normal (right) for July-September. Maps from SMN.
Over the last three months, and especially September, there was above-average precipitation from Zacatecas to northern Coahuila and Nuevo León. The greatest precipitation was in Nayarit and Sinaloa, with more than 600 mm in the region (Figure 3, left). Sonora and Chihuahua also experienced above-average precipitation, as well as portions of San Luis Potosi in the Northeast (Figure 3, left). Drought was eliminated in most of the country, except for the Baja California Peninsula and to a lesser extent in Tamaulipas (Figure 3, right).
Drought
Drought conditions persisted at levels similar to last month in New Mexico, but decreased in severity for most of Texas, according to the North American Drought Monitor (NADM) (Figure 4). Severe to exceptional drought still covers over half of New Mexico. In Texas, severe to extreme drought conditions persist in the panhandle, and moderate to severe drought is still present in a small portion of the Central part of the state. Drought conditions have been fully alleviated from the northern Mexico states, with only small areas in Chihuahua and Tamaulipas experiencing abnormally dry conditions. Drought conditions are predicted to continue, but decrease in severity across most of New Mexico, by the end of January, according to the U.S. Seasonal Drought Outlook. In southern New Mexico, drought is likely to dissipate during this time.
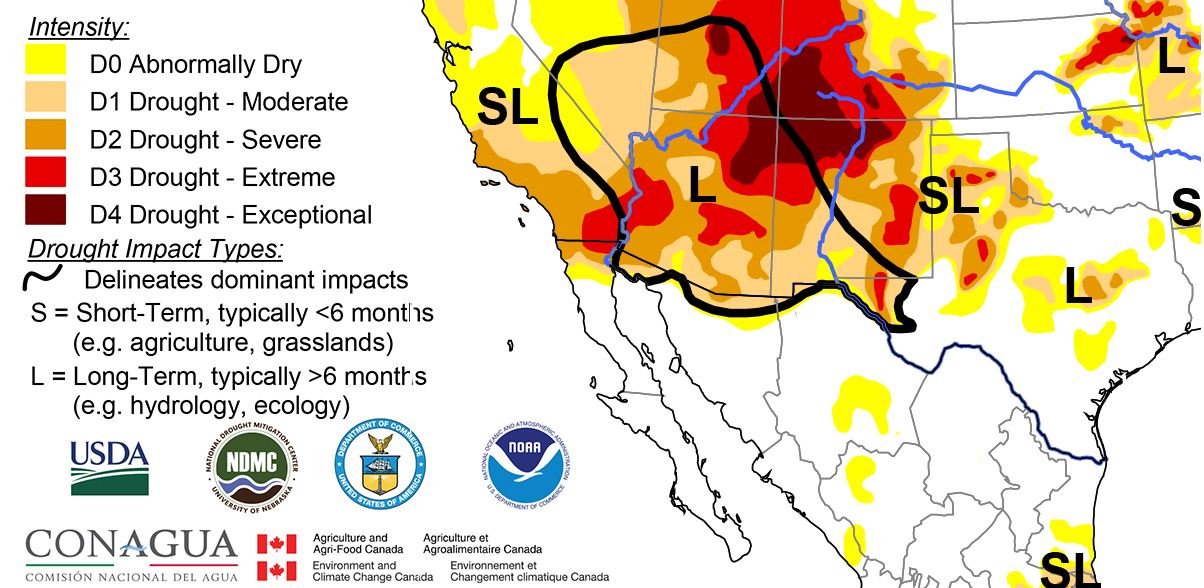 Figure 4 (above): North American Drought Monitor, released October 10, 2018.