Monsoon Tracker
*The following summary is adapted from the October 2018 issue of the CLIMAS Southwest Climate Outlook.
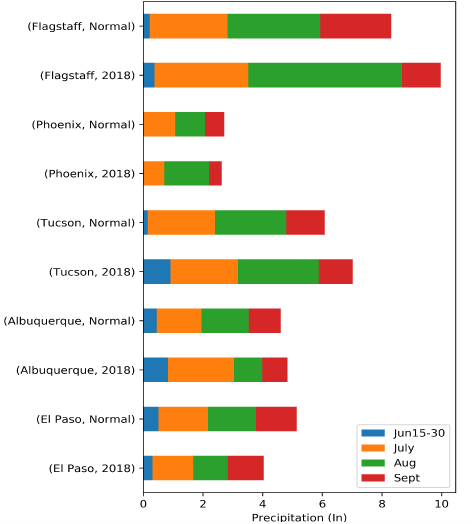
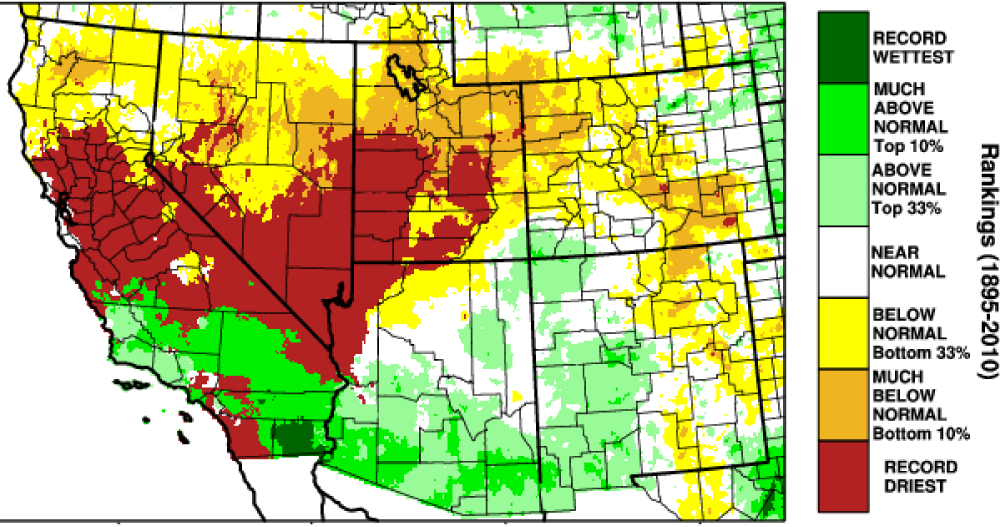
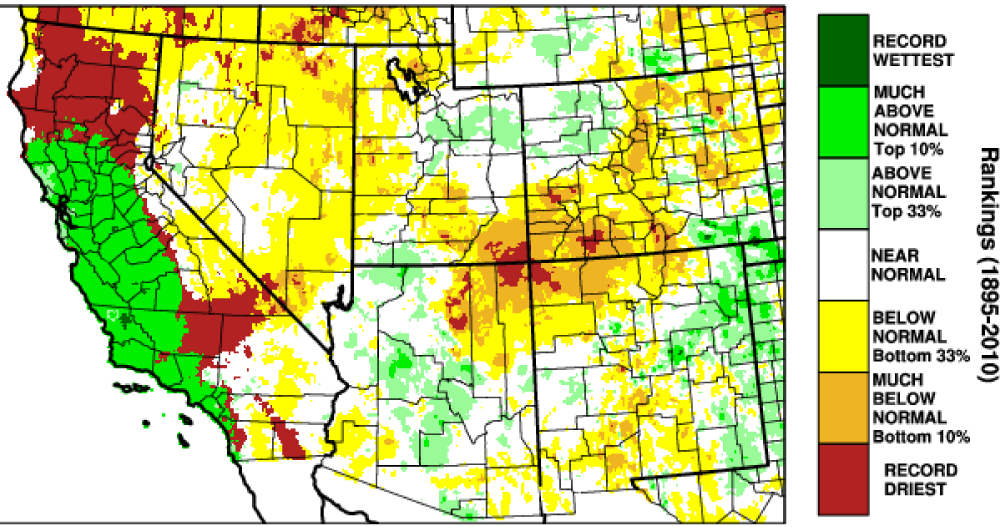
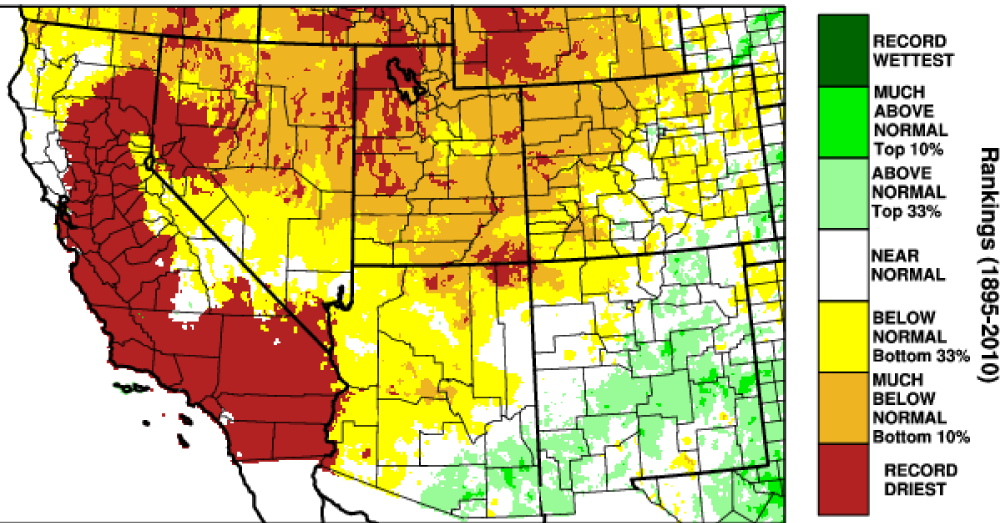
The precipitation rankings for the months that encompass the monsoon period (Figure 13) smooth out the variability over space and time that is characteristic of this season. The cumulative totals for the monsoon for most of the major metropolitan areas in the region (Figure 14) came in at or above average, with the exception of El Paso.
Figure 13 (above): June – September 2018 precipitation rankings.
Figure 14 (above): Monthly monsoon precipitation totals – 2018 vs. average.
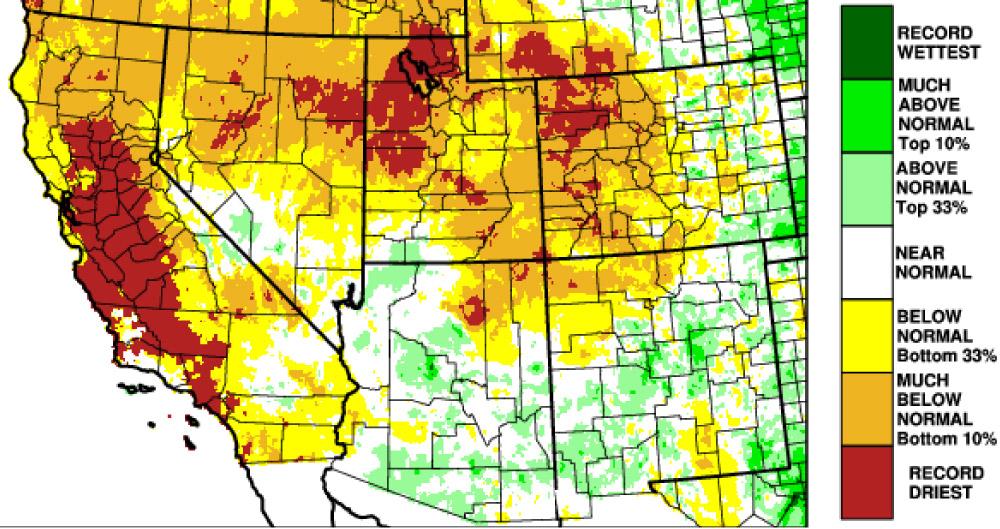
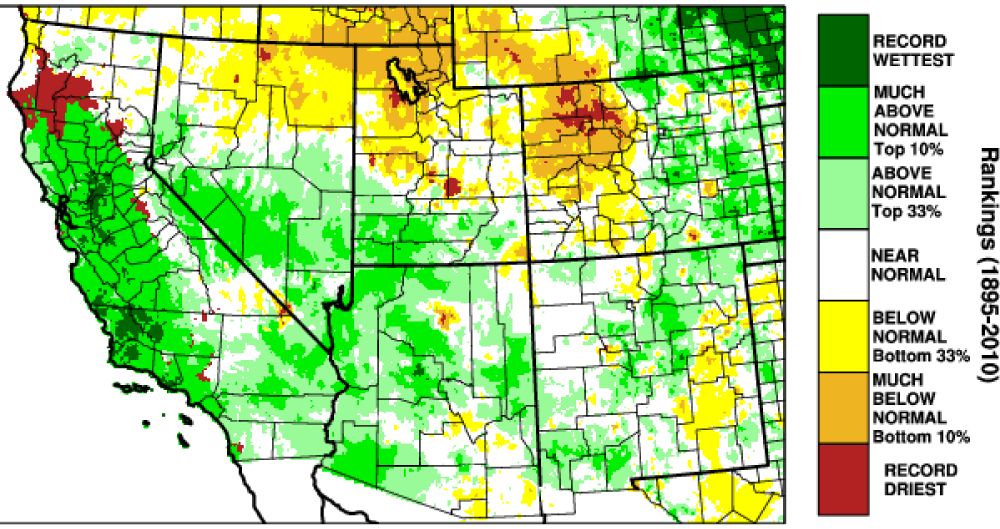
Monthly rankings show that June—which is typically dry, often with little actual precipitation at all in the Southwest—was wetter than normal across much of the borderlands region of Arizona and New Mexico (Figure 15). This was almost entirely due to Tropical Storm Bud, which brought rain to the area in mid-June. Widespread precipitation occurred across the Southwest in July, and while a few areas only received below-average precipitation, most of the region was at or above average for the month (Figure 16). August flipped that script, and while there were wide swaths of Arizona and New Mexico that received average to above-average rainfall, south-central New Mexico, parts of southern Arizona, and the Four Corners region in particular, lagged behind (Figure 17). In September, southeastern Arizona and the lower two-thirds of New Mexico received average to above-average precipitation, but this was largely due to the incursion of tropical moisture in the latter half of the month. Outside that area, the region was generally devoid of widespread precipitation, with the Four Corners region continuing to be the epicenter of below-average to record-driest conditions (Figure 18).
Looking at specific locations along the Rio Grande, Santa Fe, NM ended the season with below-average precipitation (4.55 in [116 mm], compared to an average of 6.68 in [170 mm]). Albuquerque, NM and Las Cruces, NM both ended the season at about average precipitation, with Albuquerque receiving 0.22 in (5.6 mm) above the average, and Las Cruces receiving 0.54 in (13.7 mm) below average. El Paso, TX received monsoon precipitation 1.66 in (42 mm) below the city’s average for the season, receiving 4.04 in (102 mm) compared to an average 5.7 in (144 mm). Laredo, TX and Del Rio, TX both ended the monsoon season with precipitation totals almost double their respective averages. Laredo received a total of 15.6 in (396 mm) compared to the average 8.07 in (205 mm), and Del Rio received 14.6 in (371 mm) compared to the average 7.21 in (183 mm). Finally, Brownsville ended the season with precipitation 2 in (51 mm) above average (13.9 in [353 mm] compared to an average 11.9 in [302 mm]).
Figure 15 (above): June 2018 precipitation rankings.
Figure 16 (above): July 2018 precipitation rankings.
Figure 17 (above): August 2018 precipitation rankings.
Figure 18 (above): September 2018 precipitation rankings.

