Regional Climate Overview - November 2017 - January 2018
Temperatures over the past three months (November 2017-January 2018) were 2–6 °F (1.1–3.3 °C) above average for most of New Mexico and 0–4 °F (0–2.2 °C) above average for North, West, and areas in Central Texas (Figure 1; left). Temperatures were 0–2 °F (0–1.1 °C) below average for South, East, and areas in Central Texas. Precipitation over the same time period was 0-25% of average for most of New Mexico and North Texas, and 50-70% of average for most of the remainder of the state (Figure 1; right), as a La Niña-related storm track sent storms North of the Rio Grande Basin.
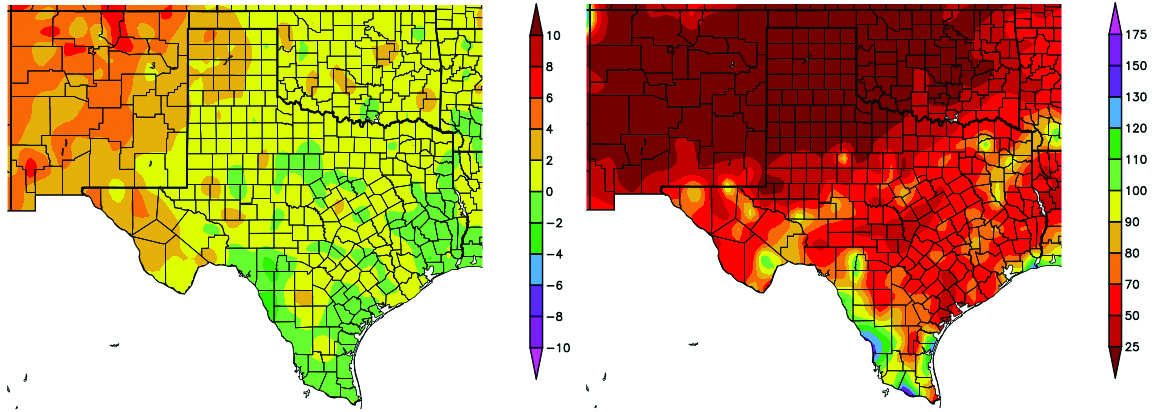
Figure 1 (above): Departure from average temperature in degrees F (left) and percent of average precipitation (right), compared to the 1981–2010 climate average, for 11/1/2017–1/31/2018. Maps from HPRCC.
Temperatures from February 1–13 were 4–8 °F (2.2–4.4 °C) above average across most of New Mexico and westernmost Texas, and 0–6 °F (1.1–3.3 °C) below average for the remainder of Texas (figure not shown). Precipitation over the same time period was 0–5% below average for almost all of Texas and New Mexico.
Five frontal passages in November, seven in December and January, and three winter storms in January were the main weather systems over northern Mexico from November 2017 to January 2018--less than average. Most of these systems arrived in the Northeast, which resulted in lower than average temperatures. Alternatively, the Northwest region was warmer than normal. Anomalies greater than 9 °F (5.0 °C) were concentrated in Chihuahua, Sonora and Durango, while northern Coahuila and southern Chihuahua had slightly below-average temperatures. The rest of the Northeast was close to average (Figure 2, left). The greater number of days with temperatures below 32 °F (0 °C) were concentrated in Chihuahua and Durango, mainly (Figure 2, right).
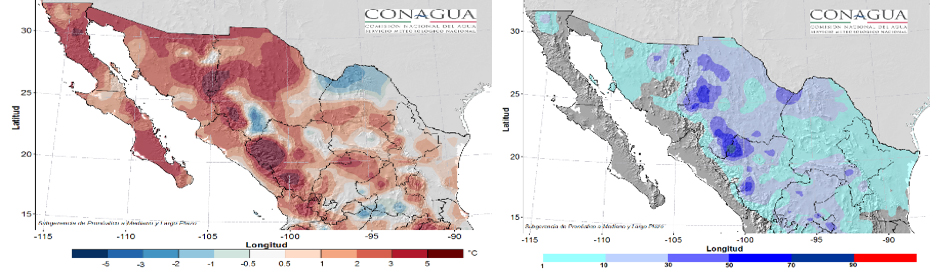
Figure 2 (above): Temperature anomalies in °C (left) and number of days with minimum temperatures at or below 0 °C (32 °F) (right) for November–January. Maps from SMN.
The last three months have been drier than normal across the Mexican Pacific side, especially in the Northwest--the main area experiencing drought conditions. Chihuahua, Zacatecas and Coahuila received above-average precipitation throughout November to January. Rainfall deficits were also present in the southern part of the Northeast (south of Tamaulipas and east of San Luis Potosí).
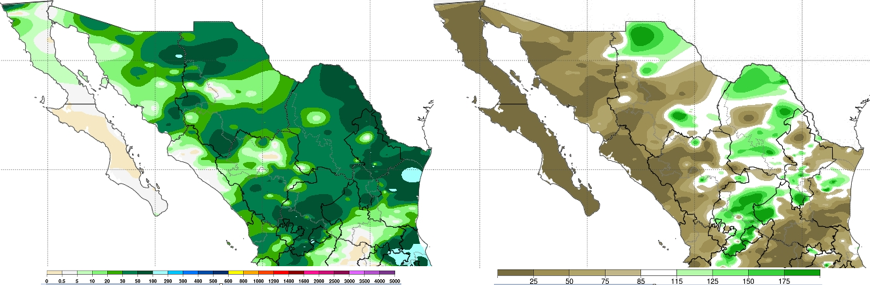
Figure 3 (above): Accumulated precipitation in mm (left) and percent of normal (right) for November–January. Maps from SMN.
On February 15, as a result of the interaction between cold, wet air associated with the jet stream, 32.5mm of rain fell at the Santa Rosa 2 station, in Trincheras, Sonora. This exceeded the monthly maximum historical record of 29.0mm on February 3, 1998 (Figure 4).
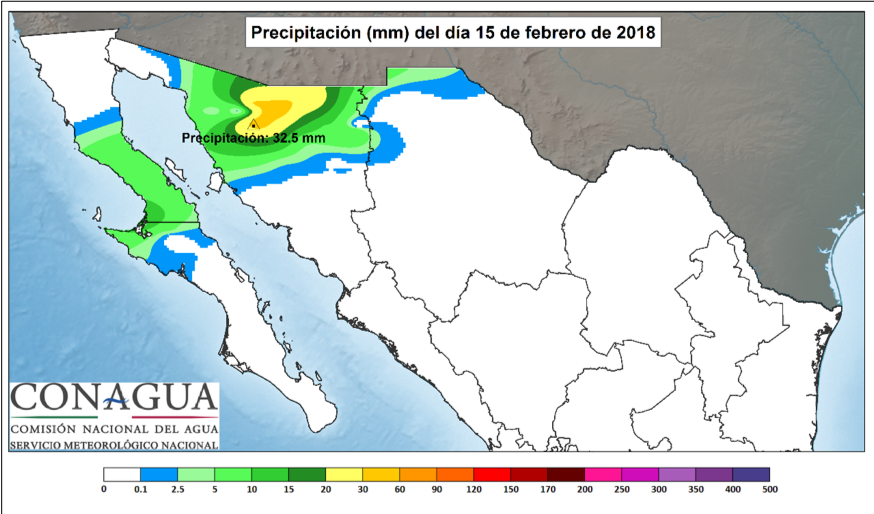
Figure 4 (above): Rainfall of 32.5 mm occurred on February 15, which exceeded the monthly historical maximum record of 29.0 (mm).
Drought
Very dry conditions during the past month have led to more intense drought conditions in New Mexico and Texas, according to the North American Drought Monitor (NADM) (Figure 5). Moderate to severe drought conditions are now present in almost all of New Mexico, and extreme drought conditions have developed in northern Texas. Mexican states bordering the Rio Bravo remain mostly drought-free, from below-average temperatures and above-average precipitation from October – December. However, abnormally dry conditions exist in parts of Tamaulipas and Chihuahua. Conditions are predicted to persist through May in New Mexico and the West half of Texas, according to the U.S. Seasonal Drought Outlook, and drought is predicted to develop in South and West Texas.
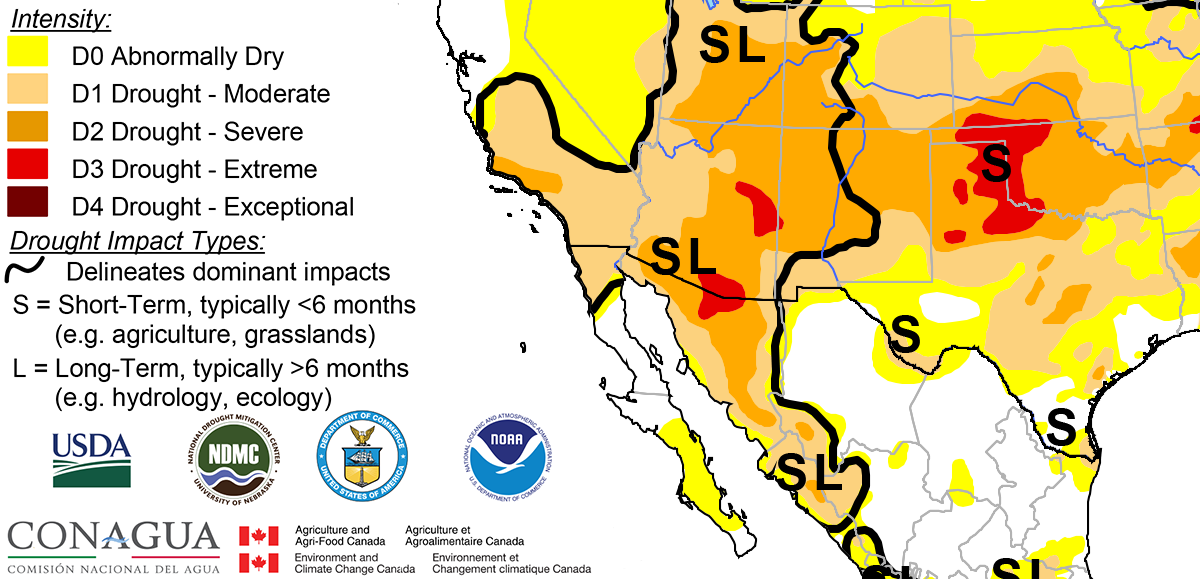
Figure 5 (above): North American Drought Monitor, released February 9, 2018.