Regional Climate Overview - January | February | March
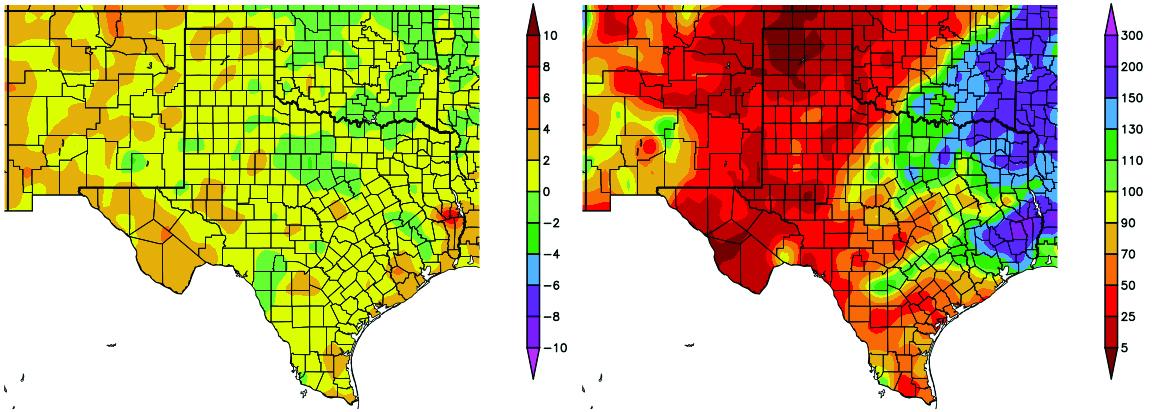
Temperatures over the past three months (January-March) were 0-4 °F (0-2.2 °C) above average for most of New Mexico and parts of southern Texas (Figure 1; left). In parts of central Texas, temperatures over the past three months were 0–2 °F (0–1.1 °C) below average. Over the same time period, precipitation was 0-50% of average for eastern New Mexico and northwestern Texas and 50-90% of average for southern Texas (Figure 1; right).
Figure 1 (above): Departure from average temperature in degrees F (left) and percent of average precipitation (right), compared to the 1981–2010 climate average, for 1/1/2018–3/31/2018. Maps from HPRCC.
Temperatures from April 1-11 were 8-10 °F (4.4-5.5 °C) above average in southwestern New Mexico and 2-6 °F (1.1-3.3 °C) above average throughout east New Mexico and west Texas. Throughout central Texas and parts along the southern Rio Grande border, temperatures were 2-4 °F (1.1-2.2 °C) below average (figure not shown). Precipitation over the same time period was 0–5 % below average for all of West Texas and most of New Mexico while 25-70% was below average for East Texas.
The first three months of the year continued to be warmer than normal in most of northern Mexico, with the exception of some areas in northern Coahuila and southern Chihuahua. The anomalies varied from greater than 9 °F (5.0 °C) between Sinaloa and Durango to lower than -0.9 °F (-0.5 °C) in southern Chihuahua and northern Coahuila (Figure 2, left). Between 50 and 70 days with minimum temperatures less than or equal to 32 °F ( 0 °C) occurred in Chihuahua and Durango; however, the between 1 and 10 days was extended in most of Durango, Coahuila, Nuevo León, Zacatecas and Tamaulipas (Figure 2, right).
 Figure 2 (above): Temperature anomalies in °C (left) and number of days with minimum temperatures at or below 0 °C (32 °F) (right) for January-March. Maps from SMN.
There were at least three areas with accumulated rainfall greater than 100 mm; in northern Sonora, Southwest Chihuahua and northern Tamaulipas. These areas received the greatest amount of rainfall (Figure 3, left). However, wetter than normal areas were located in northern Sonora, most of Zacatecas and parts of Nuevo León and northern Tamaulipas. Most of northern Mexico is affected by drought and has received less than 25% of normal precipitation from January to March (Figure 3, right).
 Figure 3 (above): Accumulated precipitation in mm (left) and percent of normal (right) forJanuary-March. Maps from SMN.
Drought
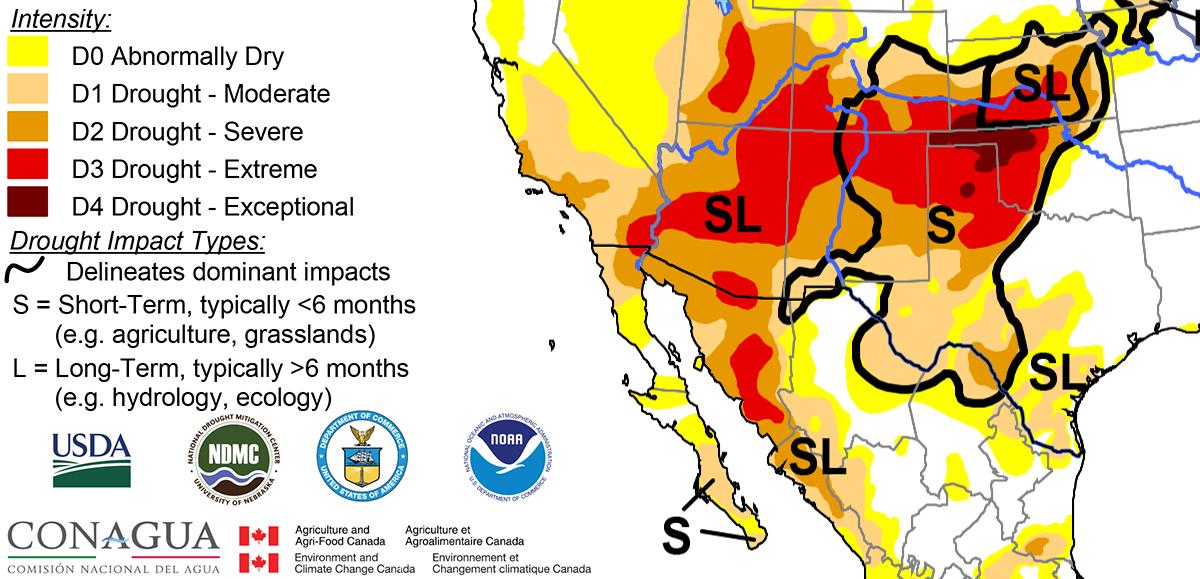
Drought conditions continue to worsen in New Mexico and Texas as dry conditions have persisted in the past months, according to the North American Drought Monitor (NADM) (Figure 4). Severe drought conditions have intensified throughout northern New Mexico and Texas and exceptional drought conditions (D4) are now present in parts of northern Texas and New Mexico. Moderate to severe drought conditions remain in most of New Mexico and southwestern Texas. Severe drought conditions have developed along the Rio Grande Border of Texas and Coahuila while abnormally dry conditions increased in the bordering Mexican states of the Rio Bravo. Conditions are predicted to persist through July in West New Mexico, and improve in northern Texas and East New Mexico, with drought removal likely in cities in Texas along the Chihuahuan border, according to the U.S. Seasonal Drought Outlook.
Figure 4 (above): North American Drought Monitor, released April 10, 2018.


