Monsoon Tracker
*The following summary is adapted from the July 2018 issue of the CLIMAS Southwest Climate Outlook.
Monsoon season has officially begun in the Southwest U.S and northern Mexico. In 2008, the U.S. National Weather Service (NWS) changed the definition of the start of the North American monsoon from a variable date based on locally measured conditions to a fixed date of June 15 (and an end date of September 30). Prior to 2008, the start date reflected the seasonal progression of the monsoon (Figure 13), based on larger seasonal atmospheric patterns.
.jpg)
Figure 13: Historical Monsoon Onset Date. Source: Australian Bureau of Meteorology.
In southern Arizona, the start date was based on the average daily dewpoint temperature. Phoenix and Tucson NWS offices used the criteria of three consecutive days of daily average dewpoint temperature above a threshold (55 degrees in Phoenix, 54 degrees in Tucson) to define the start date of the monsoon. The average daily dewpoint temperature is still a useful tool to track the onset and progression of conditions that favor monsoon events, and the NWS includes a dewpoint tracker in their suite of monsoon tools. Thirty-year averages for daily dewpoint and precipitation demonstrate the gradual increase in dewpoint temperatures during the monsoon season, as well as the variability of precipitation observed over the same window (Figure 14).
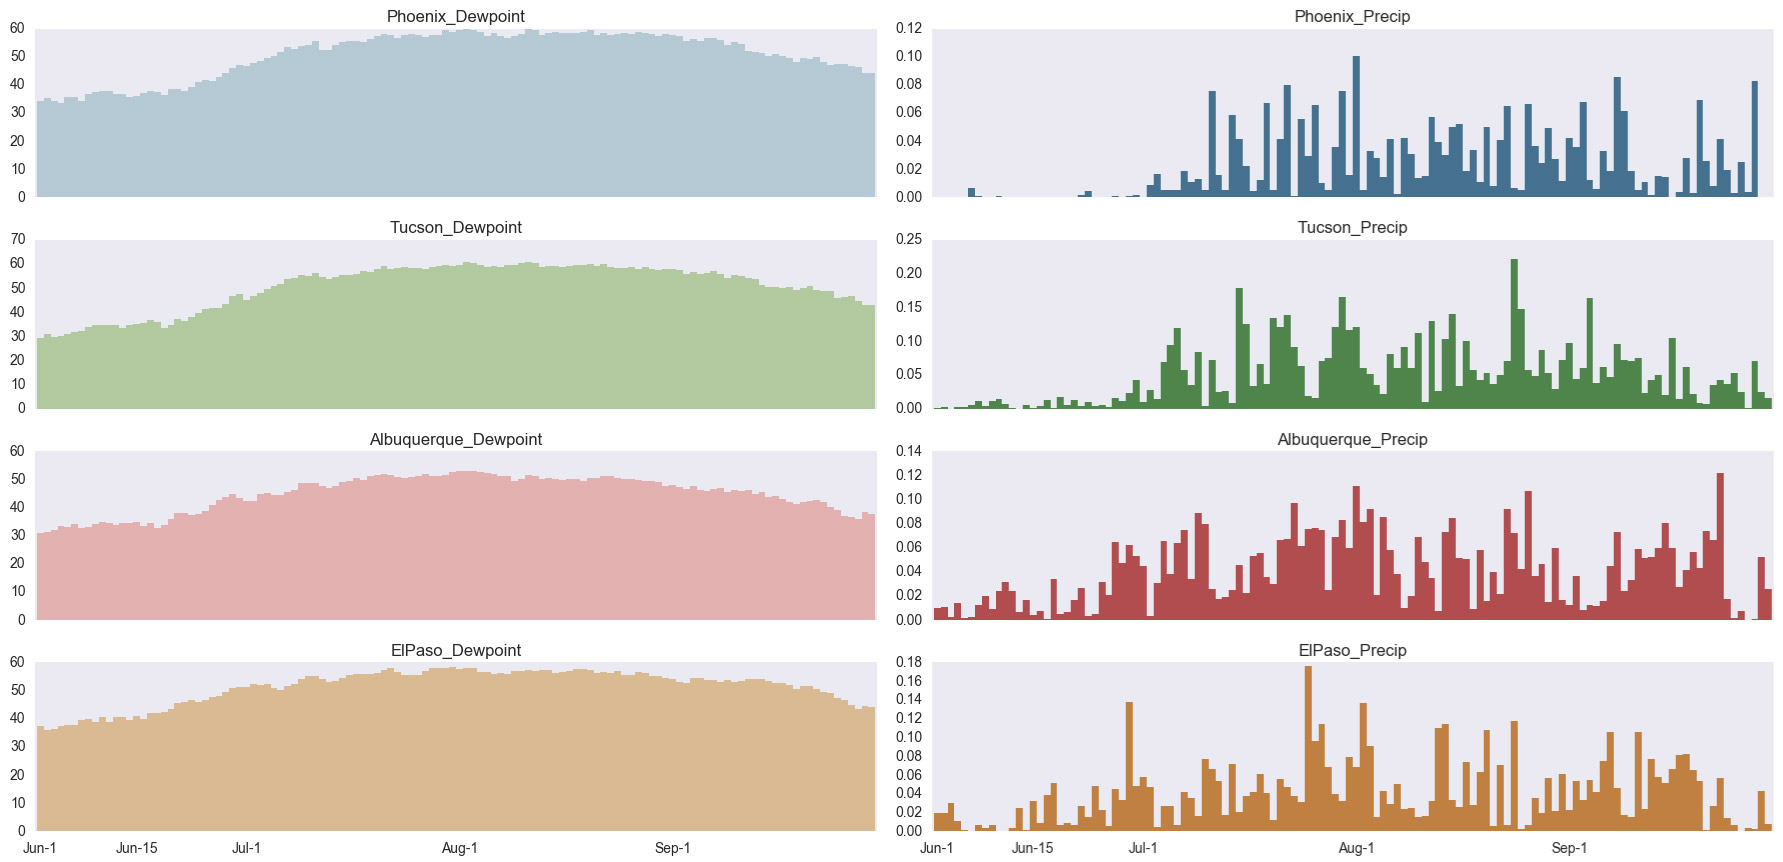 Figure 14 (left): Average daily dewpoint temperature (left [°F]) and average daily precipitation (right [in.]).
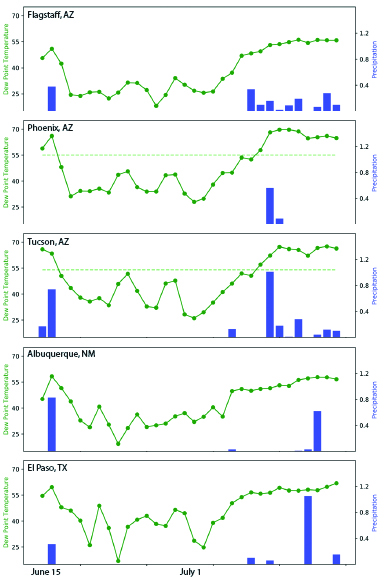 Using the dewpoint definition, the monsoon began in Tucson and Phoenix on July 8 this year and on July 6 for El Paso. While an imperfect measure, this increase in dewpoint temperature contextualizes the slightly later-than-average start to monsoon activity compared to climatology, and roughly corresponds with upticks in precipitation activity across the Southwest (Fig. 15). Despite the relatively late start, the monsoon is now in full swing. The seasonal totals since June 19th (Fig. 16) and the percent of average precipitation (Fig. 17) help characterize the spatial variability and intensity of the monsoon thus far.
Figure 15 (right): Dew Point Temperature [°F] & Daily Precipitation [in.], June 15-July 16.
Additional Monsoon Resources:
• NWS: http://www.wrh.noaa.gov/twc/monsoon/monsoon_info.php
• CLIMAS: http://www.climas.arizona.edu/sw-climate/monsoon
• CONAGUA: http://www.gob.mx/conagua/prensa/inicio-el-monzon-de-norteamerica-en-el-noroeste-de-mexico
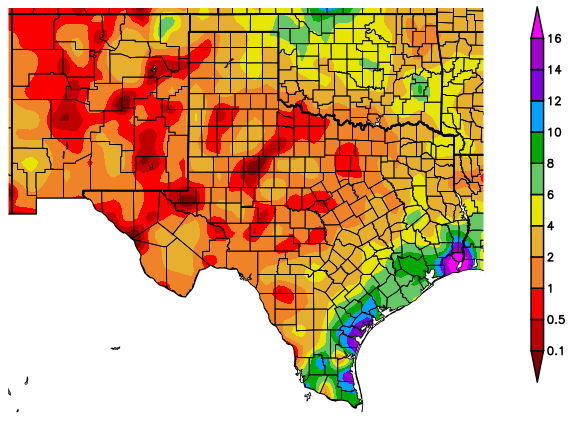
Figure 16 (above): Total precipitation (in inches), June 19-July 18. Maps from HPRCC.
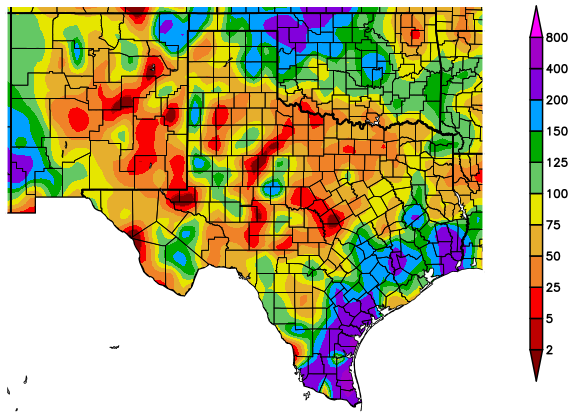
Figure 17 (above): Percent of average precipitation, June 19-July 18. Maps from HPRCC.