Regional Climate Overview - March | April | May
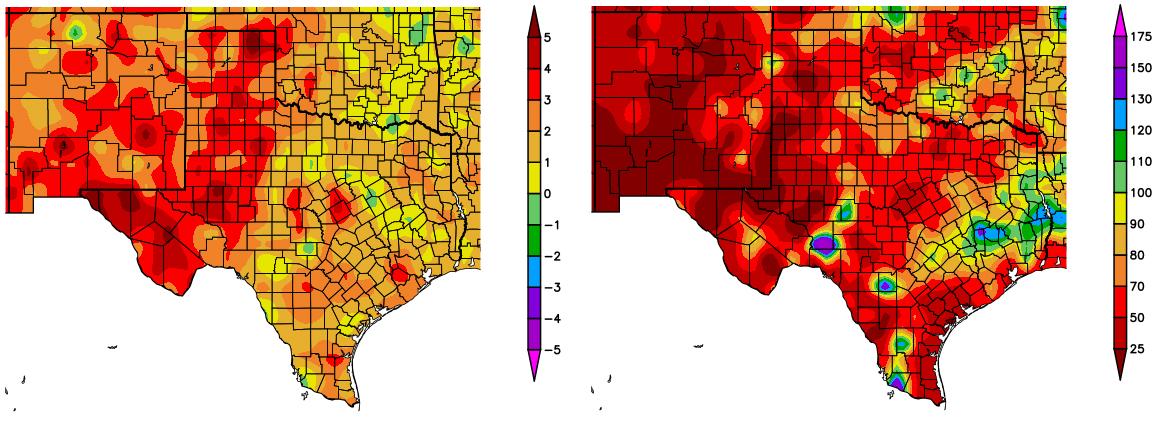
Temperatures over the past three months (March-May) were 2-5 °F (1.1-2.8 °C) above average for most of New Mexico and Texas (Figure 1; left). Precipitation over the same time period was 0-50% of average for most of both states, with small pockets in Texas experiencing precipitation 110-150% of average (Figure 1; right).
 Figure 1 (above): Departure from average temperature in degrees F (left) and percent of average precipitation (right), compared to the 1981–2010 climate average, for 3/1/2018–5/31/2018. Maps from HPRCC.
Temperatures for January-May have been record warmest for El Paso, Texas and Albuquerque, New Mexico. Temperatures in May were the second warmest on record in Texas, and third warmest for New Mexico, and precipitation was much below normal for both states during the month. In Texas during May, there were several tornadoes and reports of golfball- to baseball-sized hail across the state (NOAA State of the Climate).
Temperatures from June 1-19 were 2-6 °F (1.1-3.3 °C) above average in most of New Mexico and Texas. Areas in North-Central Texas experienced temperatures 6-8 °F (3.3-4.4 °C) above average (figure not shown). Precipitation over the same time period was 200-800% of average for the western half of New Mexico, as well as the Southeast corner of the state on the border with Texas. Northeast New Mexico and most of Texas received precipitation 0-75% of average.
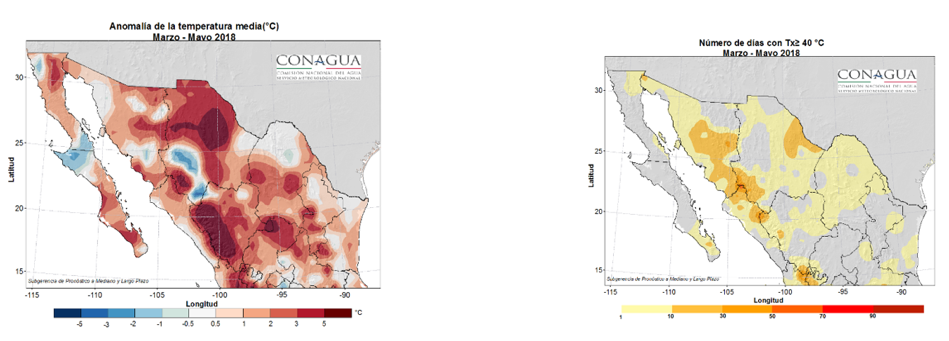
With the exception of parts of Baja California and southern Chihuahua, most of Northwest Mexico continued to experience above-average temperatures from March to May. The highest positive anomalies, greater than 9 °F (5 °C), occurred in regions of Chihuahua and Durango; while areas in the Northeast had close to normal temperatures (Figure 2, left). Southern Sonora and Chihuahua, as well as northern Sinaloa, experienced the greatest number of days (50 days) with maximum temperatures at or above 104°F (40°C) (Figure 2, right). The areas that experienced between 1 to 10 days were in Sonora, Chihuahua, Sinaloa, Durango and Coahuila.
Figure 2 (above): Temperature anomalies in °C (left) and number of days with maximum temperatures at or above 104 °F (40 °C) (right) for March–May. Maps from SMN.
Between March and May, the only region in Mexico with above-average rainfall was the Northeast part of the country where precipitation was 4-8 inches (100-200 mm) from March-May, more than 15% above average (Figure 3, left). Alternatively, drought intensified in the Northwest, with less than 0.2 inches (5 mm) of precipitation in most of Sonora and Sinaloa, and between 0.4 and 0.8 inches (10 and 20 mm) in Chihuahua and Durango, less than 25% of average (Figure 3, right). According to Figure 3, precipitation associated with the monsoon was not observed in northwestern Mexico until May 31.
Figure 3 (above): Accumulated precipitation in mm (left) and percent of normal (right) for March–May. Maps from SMN.
Drought
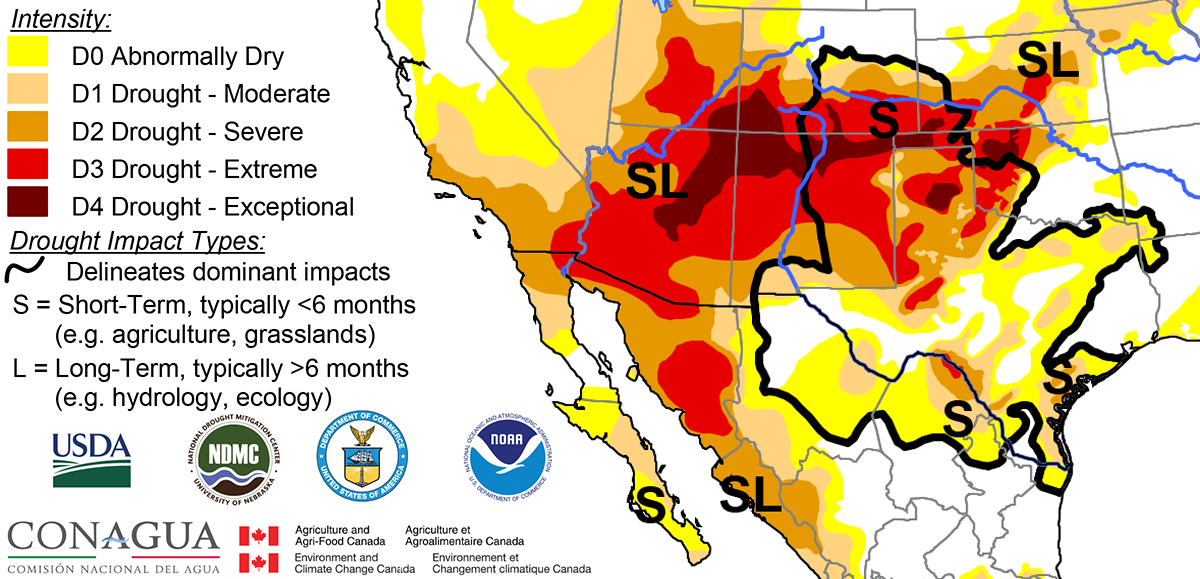
Drought conditions intensified in New Mexico over the past month, but improved slightly in Texas and northern Mexico, according to the North American Drought Monitor (NADM) (Figure 4). Exceptional and extreme drought conditions expanded in New Mexico to cover the northern half of the state. In Texas, severe to exceptional drought persists in the panhandle, and along the U.S.-Mexico border near Del Rio, and abnormally dry conditions persist in the northern Mexico states. Drought development is likely in Central Texas by the end of September, and drought conditions are predicted to persist on the U.S.-Mexico border near Del Rio and in eastern and North-Central Texas, according to the U.S. Seasonal Drought Outlook. Drought is predicted to remain but become less severe in most of New Mexico and the western Texas panhandle, and termination of drought conditions is likely in southern Texas.
 Figure 4 (above): North American Drought Monitor, released June 8, 2018.


