Monsoon Tracker
Monsoon Tracker
*The following summary is adapted from the September 2018 issue of the CLIMAS Southwest Climate Outlook.
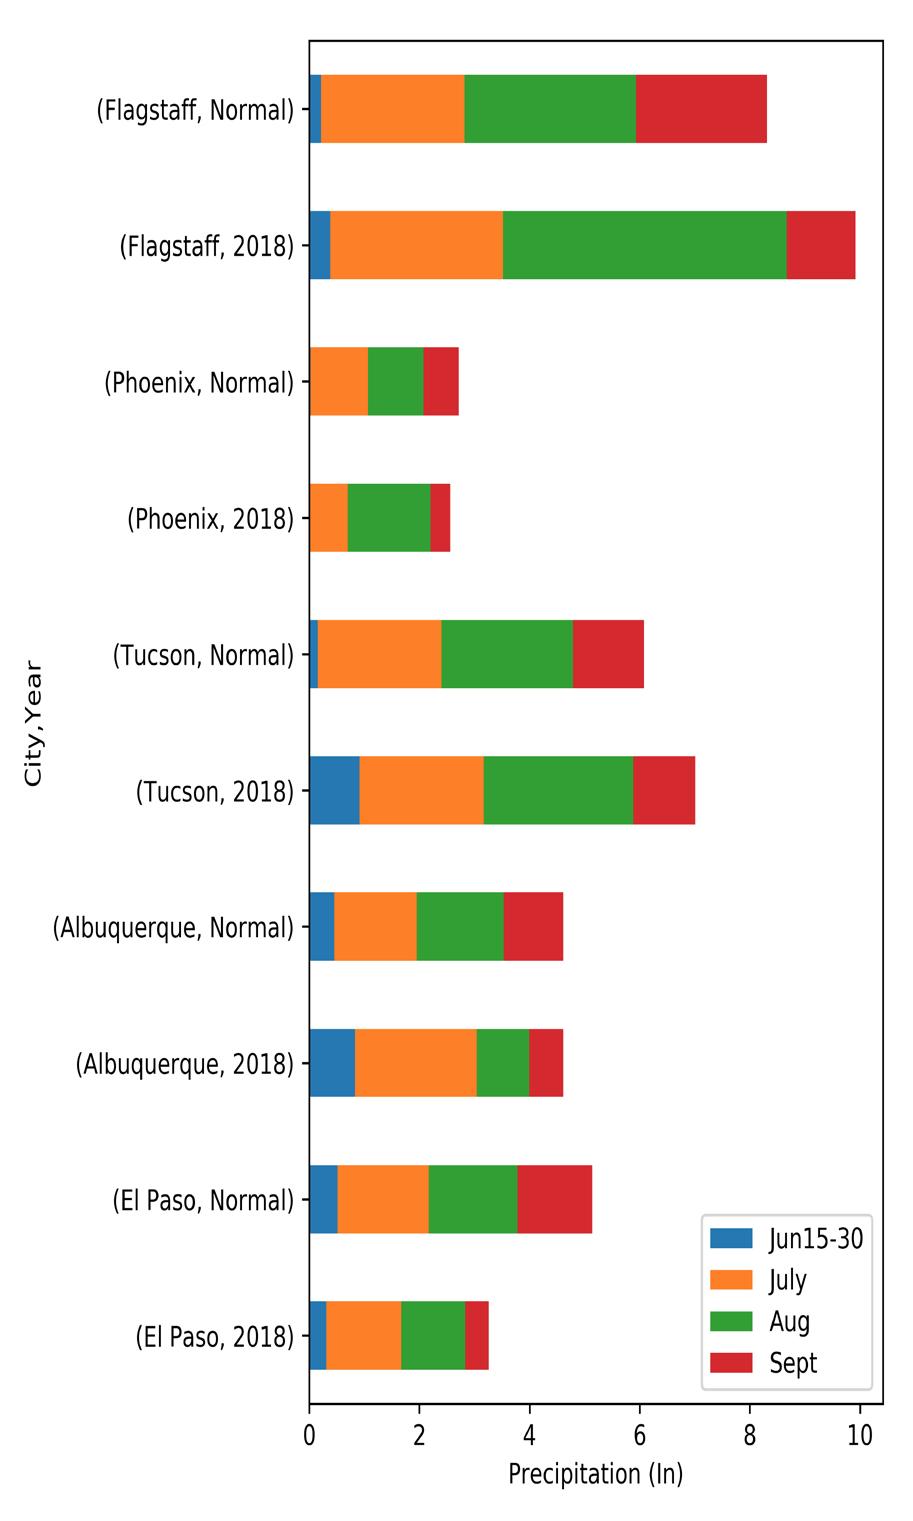
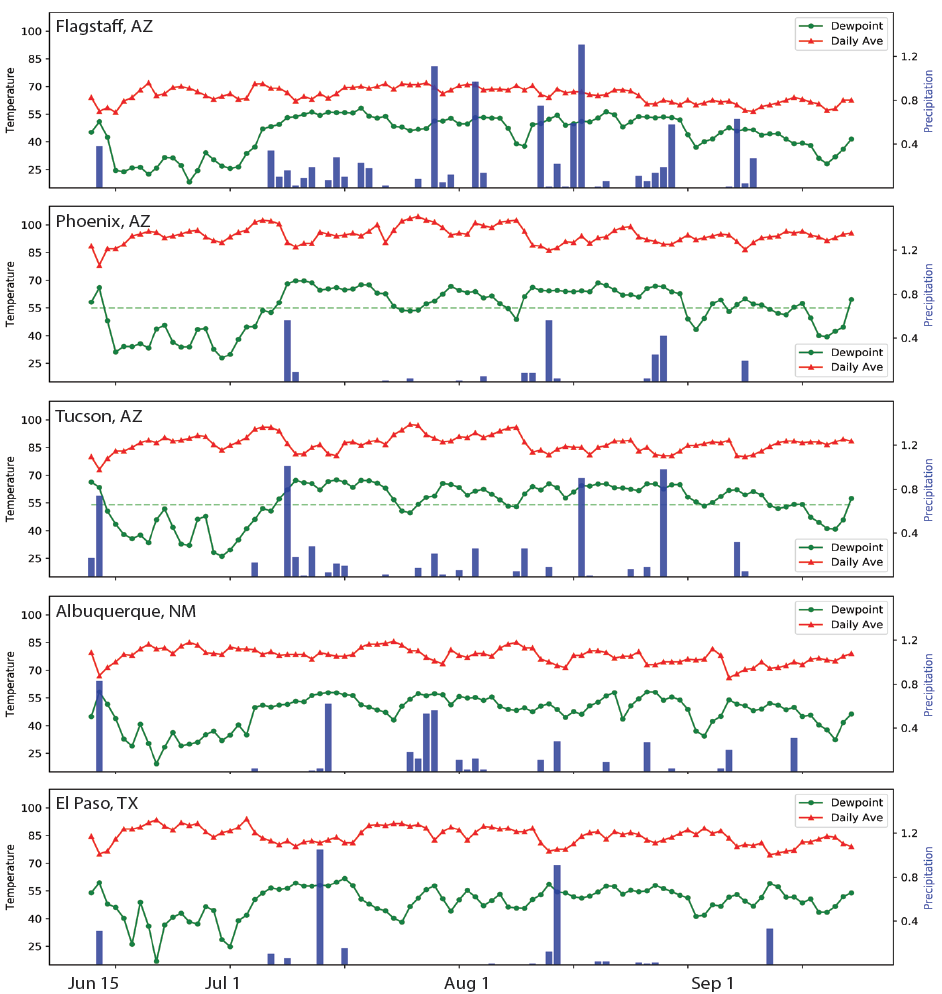
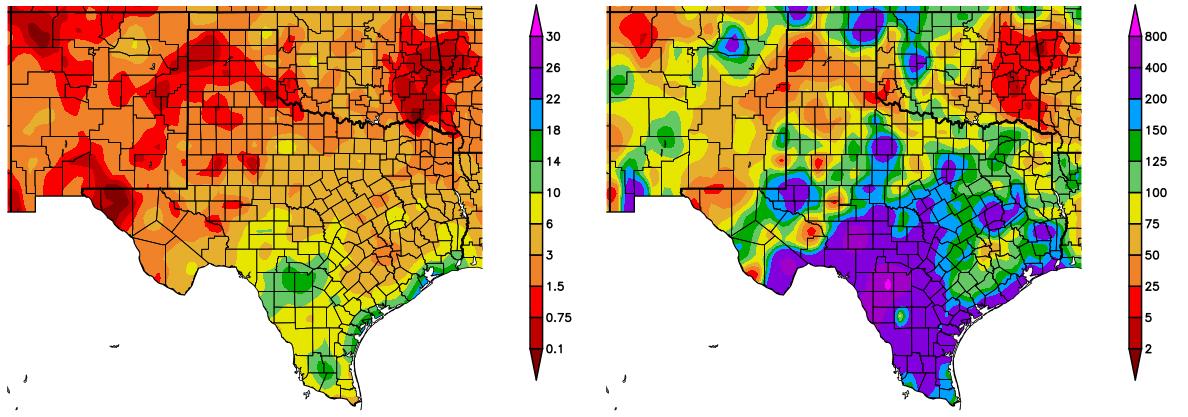
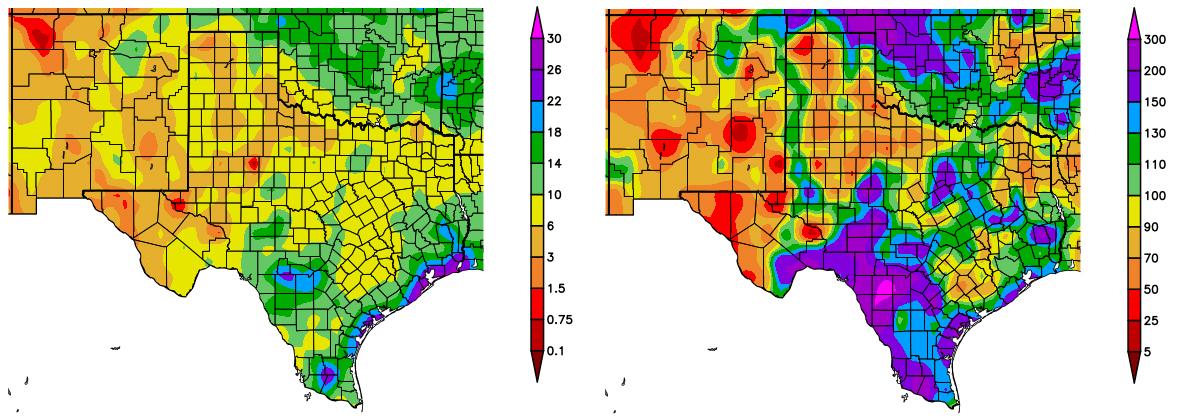
Monsoon precipitation varies considerably in space and time across the Southwest, as illustrated by monthly totals for various stations (Fig. 13). Statewide patterns highlight widespread areas of both above- and below-average totals (see Fig. 15 and 16). The Fig. 14 plots of daily precipitation, temperature, and dewpoint temperature for the same stations as Fig. 13 capture the intermittent nature of monsoon precipitation as well as the persistent elevated dewpoint most locations experienced this summer.
In many years, breaks in monsoon activity (sometimes for extended periods) occur, characterized by decreased humidity and increased temperatures. While we had fewer such intervals this year, that was no indicator of consistent precipitation (El Paso and Phoenix are both good examples). As noted last month, sustained periods of high dewpoints without precipitation led to extreme heat warnings in the region and persistent warm overnight temperatures. Without storm-induced cooling, elevated dewpoint temperatures can be downright miserable, especially for households that rely on evaporative coolers for interior climate control.
The seasonal totals and percent of average precipitation since August 21 (Fig. 15) and June 21 (Fig. 16) help characterize the spatial variability and intensity of the monsoon thus far. Looking at city totals as of September 20, Albuquerque and Las Cruces, NM have both received average precipitation since the start of the monsoon. El Paso, TX has received below-average precipitation, and other cities along the TX-Mexico border have received above-average precipitation.
Figure 13 (above): Monthly monsoon precipitation totals – 2018 vs. average.
Figure 14 (above): Dewpoint and daily average temperature, daily precipitation, June 15-August 13, 2018.
Figure 15 (above): Total precipitation (in inches) (left), and percent of average precipitation (right), for August 21-September 19. Maps from HPRCC.
Figure 16 (above): Total precipitation (in inches) (left), and percent of average precipitation (right), for June 21-September 19. Maps from HPRCC.
Additional Monsoon Resources:
• NWS: http://www.wrh.noaa.gov/twc/monsoon/monsoon_info.php
• CLIMAS: http://www.climas.arizona.edu/sw-climate/monsoon
• CONAGUA: http://www.gob.mx/conagua/prensa/inicio-el-monzon-de-norteamerica-en-el-noroeste-de-mexico


